Optical pulse evolution in the presence of a probe light in CW-pumped nonlinear fiber
Chen Wei, Zhang Xue-Liang, Hu Xiao-Yang, Song Zhang-Qi, Zhou Meng
Academy of Ocean Science and Engineering, National University of Defense Technology, Changsha 410073, China


† Corresponding author. E-mail: kevinkobegames@126.com

Abstract

We investigate theoretically and numerically the evolutions of optical pulses in the time domain due to modulation instability (MI), where CW pump accompanied with a probe is used as the input of nonlinear fiber. As the fiber length increases, we show that it exhibits beat frequency between the pump and the probe first when the probe lies outside the MI resonance region, and then gradually transforms into a pulse train resulting from spontaneous MI rather than induced MI. However, the regular pulse train is easier to generate in the whole fiber if the probe exists in MI resonance region, and the period of the pulse train is inversely proportional to the frequency spacing between the pump and the probe. It is emphasized that the pulse period can be adjusted only when the probe is in MI resonance region. The numerical simulations are in agreement with the theoretical results. The obtained results are guidable for generating and manipulating the optical pulse train in the fiber.

1. Introduction

Modulation instability (MI) is a significant nonlinear effect in optical fiber, which is caused by the interaction between fiber dispersion and nonlinearity.[13] In the frequency domain, MI manifests itself as two symmetric spectral sidelobes, while it splits into a short-pulse train in the time domain for CW or quasi-CW. As is well known, MI can be divided into spontaneous MI and induced MI, which result from the background noise and the probe light, respectively.[1] For the latter, it has been widely accepted that the period of the generated pulses is inversely proportional to the frequency spacing between the pump and the probe, since it was first reported by Tai et al. in 1986.[4,5] It means that the period of pulses can be manipulated by changing the position of the probe in the input spectrum based on induced MI. However, in the authors’ opinion, the above conclusion should be limited to the condition that the probe exists within the region of spectral sidelobes caused by spontaneous MI, which corresponds to the so-called MI resonance.[6] In the MI resonance region, the efficiency of four-wave mixing (FWM) induced by MI is highly improved,[79] and a frequency comb structure always occurs. On the contrary, if the probe lies out of MI resonance region, the performance of the generated pulse train will become rather different, and this will be investigated in detail in the present paper.

The aim of this paper is to investigate different characteristics of pulse evolution when the probe is in and outside the MI resonance region, respectively. The CW pump and high nonlinear fiber are used. It is supposed that the bandwidth of the pump is broad enough for stimulated Brillouin scattering (SBS) not to occur. Stimulated Raman scattering (SRS) is also absent if the pump power is lower than its threshold. To be noticed, the performance of generated pulses changes when SRS is considered, which is not the task of this paper but well presented in Ref. [10].

2. Theory

The CW pump accompanied by a probe is used as an input. It can be divided into two cases, i.e., the probe lies in and outside the MI resonance region of the pump. The two different cases will first be investigated theoretically in the following.

2.1. With a probe outside MI resonance region

At the beginning of the fiber, there are only the pump and the probe in the spectrum. However, as fiber length increases, spontaneous MI occurs with two symmetric spectral sidelobes. The maxima of the sidelobes correspond to the first-order MI frequency peaks. Then the second-order MI frequency peaks emerge due to the FWM effects between the first-order frequency peaks and the pump. There are similar processes for higher-order MI frequency peaks. Finally, a frequency comb structure is present composed of different orders of frequency peaks, which has been found experimentally in our former researches.[11] To be noticed, these MI frequency peaks resulting from FWM processes satisfy phase-matching condition precisely.[1] Moreover, the power of higher-order peaks is lower than that of lower-order ones. To simplify the model and obtain an analytical expression, it is supposed that the power decrease between adjacent frequency peaks is the same. This hypothesis will not change the variation trend of the results, in our opinion, because the difference between the real case and the supposed one only exists in the exact value of the power of different-order peaks. The reasonableness of this hypothesis can also be confirmed by the simulation results of the generalized nonlinear Schrödinger equation in the next section. Therefore, at a given fiber length, the complete electric field can be expressed as

where the first, second, third, and fourth terms on the right-hand side of the equation correspond to the probe, the pump, the different orders of peaks in the lower and higher frequency regions, respectively; and denote the electric field of the probe and the pump, respectively; and represent the angular frequency spacing and phase difference between the pump and the probe, respectively; Ω and refer to the angular frequency spacing and phase difference between adjacent MI peaks, respectively; denotes the angular frequency of the pump, a is the amplitude ratio between adjacent MI peaks; 2N + 1 is the total number of frequency peaks included. The final expressions of Eq. (1) have three different forms (i.e., Eqs. (2), (4), and (7) below), which correspond to the front, middle, and back sections of the fiber, respectively.

In the front section of the fiber, the MI effect is so weak that it can be ignored, leaving only the pump and the probe. Therefore, the complete electric field in Eq. (1) can be simplified as

Using Eq. (2), the corresponding intensity can be obtained from

where and denote the intensity of the probe and the pump, respectively. Obviously, it corresponds to the beat between the pump and the probe for this case.

However, in the back section of the fiber, MI becomes so strong that different orders of frequency peaks occur simultaneously with their phases matched. As a result, the comb-like structure resulting from MI has a dominant effect if the probe is weak enough. Thus the influence of the probe can be excluded and the corresponding electric field can be expressed as

The above expression can be further derived as (see Appendix A)

Using Eq. (5), the corresponding intensity can be easily obtained from

Furthermore, for the middle section of the fiber, both the frequency comb and the probe should be considered, and the electric field can be expressed as

Using Eq. (7), the corresponding intensity can be finally obtained from

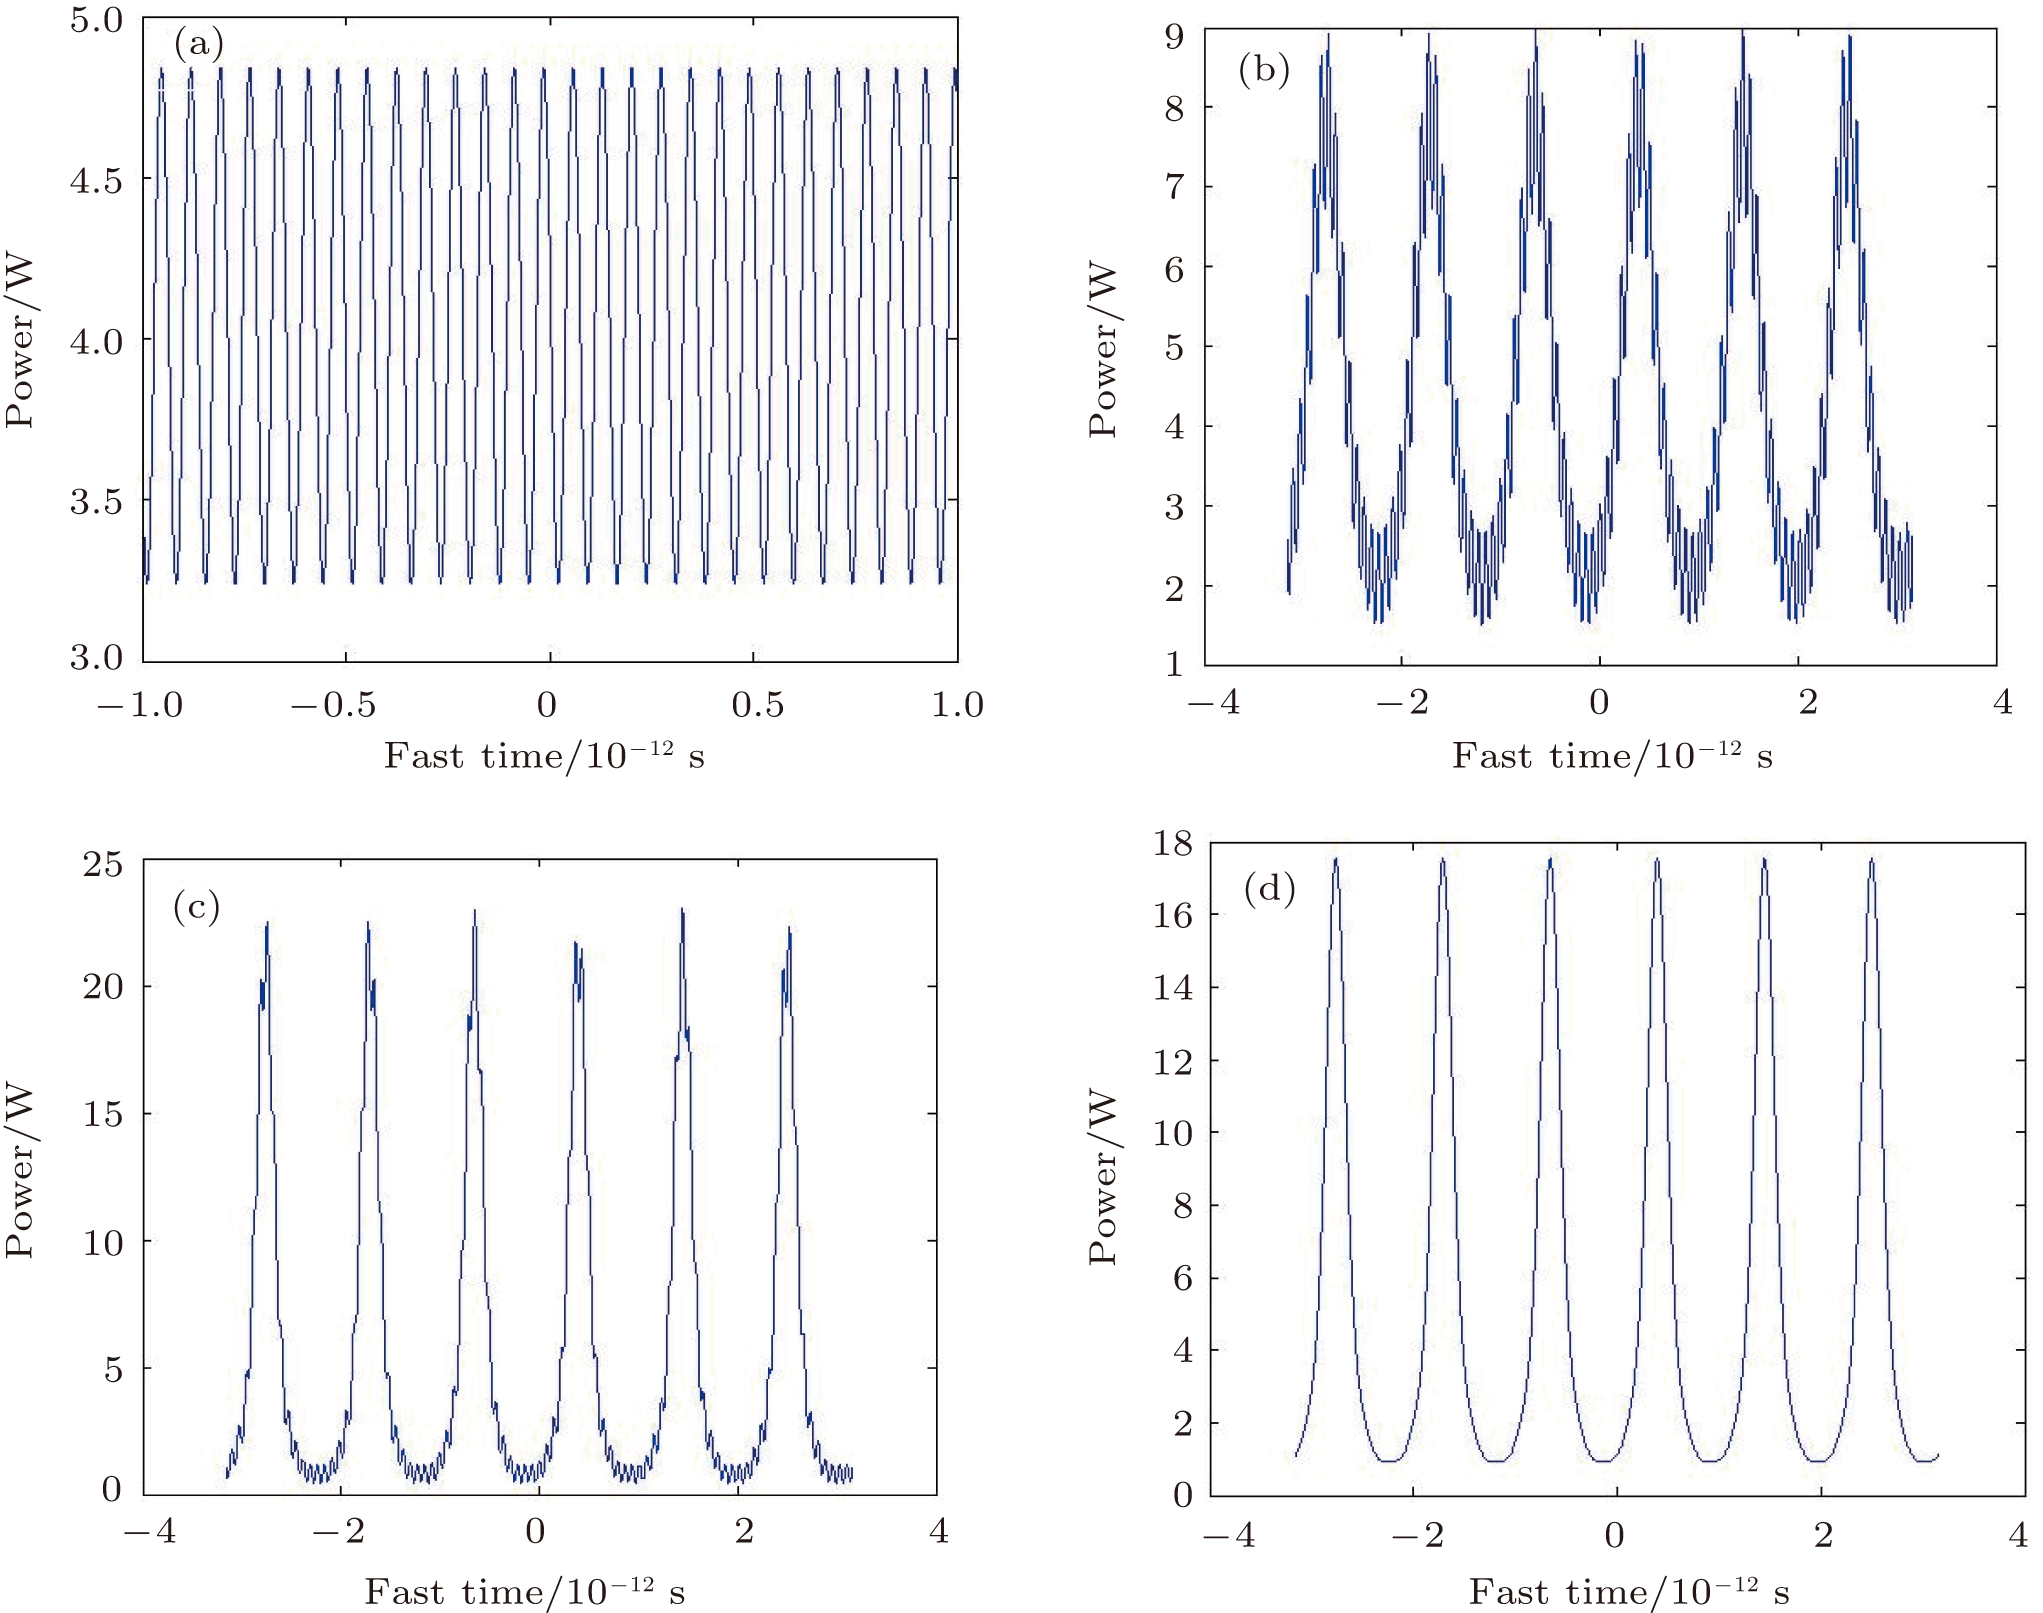
Based on Eqs. (3), (6), and (8), the time-domain waveforms for different cases can be obtained. The parameters are set as follows. = 0.04 W, = 4 W, × 13.86 THz, and THz, while a, N, , and are selected properly according to the simulation results in the next section. Considering that the probe power is not so weak, equations (3) and (8) are used for analysis as shown in Figs. 1(a)1(c).

Fig. 1. (color online) Theoretical results of time-domain waveforms with N = 4, , and . (a) The MI effect is weak and negligible; (b) the MI effect is medium with a = 1/6; (c) the MI effect is significant with ; (d) the probe is negligible or in the MI resonance region with a = 5/14.

Figure 1(a) shows the time-domain waveform in the presence of only pump and probe. The period of the waveform is ps, which corresponds to a frequency of 13.89 THz. By comparing with the parameters used, the little frequency difference comes from the used time resolution (1 fs). The average power is 4.04 W corresponding to the , the maximum is 4.84 W corresponding to , and the minimum is 3.24 W corresponding to .

Figure 1(b) shows the waveform with a medium level of MI, while figure 1(c) shows the one with a high level. It can be found that the pulse shape becomes more obvious with the enhancement of MI effect. The repetition frequency of the pulses is 0.93 THz (corresponding to a period of ps), which is approximately equal to the frequency spacing between adjacent MI peaks. In addition, many burrs occur in Fig. 1(b), which result from the beat between the pump and the probe, while they almost disappear in Fig. 1(c). If the difference in initial phase varies, the positions of the pulses change, with their shapes unchanged.

2.2. With a probe in MI resonance region

On the contrary, when the probe lies in MI resonance region, MI-induced FWM becomes significant, leading to the occurrence of frequency-comb-like structure. It corresponds to the case expressed by Eq. (6) as shown in Fig. 1(d). It can be found that the time-domain pulse shape is quite regular with the phase-matched frequency peaks in the spectrum. The relation between frequency comb and temporal pattern was also investigated in Ref. [12], which focused on the case of a resonant cavity instead.

2.3. Numerical simulation

As is well known, the generalized nonlinear Schrödinger equation can be used to numerically simulate optical transmission in the fiber,[1] and it can be expressed as

where and denote the second- and third-order dispersions, α and γ denote the fiber attenuation and nonlinear coefficients, respectively. The third-order dispersion is related to the generation of dispersive wave (DW).[13] Also, the phenomenon of Fermi–Pasta–Ulam (FPU) recurrence is present due to MI as the fiber length increases.[14,15] Both DW and FPU recurrences can lead to a power conversion of the pump. The angular frequency range of the MI resonance region is between zero and , and the angular frequencies of MI peaks are , where denotes the input pump power.[1] The parameters used in the simulations are as follows. The wavelength , the input pump power , the fiber length , , , dB/km, and . The above values are the same as those used in Ref. [10] except for the pump power and fiber length, in order to reflect the characteristics of the real fiber and ensure the occurrence of MI. For the above values, the frequency range of resonance region can be calculated to be between zero and ±1.7 THz. To be noticed, this resonance region is obtained without considering the fiber attenuation, and there will be a little difference when the effect of fiber attenuation is included. Therefore, it is better to distinguish whether a probe lies in MI resonance region by using numerical simulations where the fiber attenuation is considered. Furthermore, the occurrence of MI is related to the background noise level.[16] Here, quantum noise is selected as the input noise condition, which equals half a photon per mode. The spectrum range of the quantum noise covers the concerned range in the following simulations, which is between −20 THz and 20 THz. The power spectrum density of the quantum noise corresponds to about −170 dBm/Hz, which can also be found in the following simulations. The split-step Fourier method is used to carry out the simulation.[1]

3. Simulation results and discussions
3.1. Without a probe

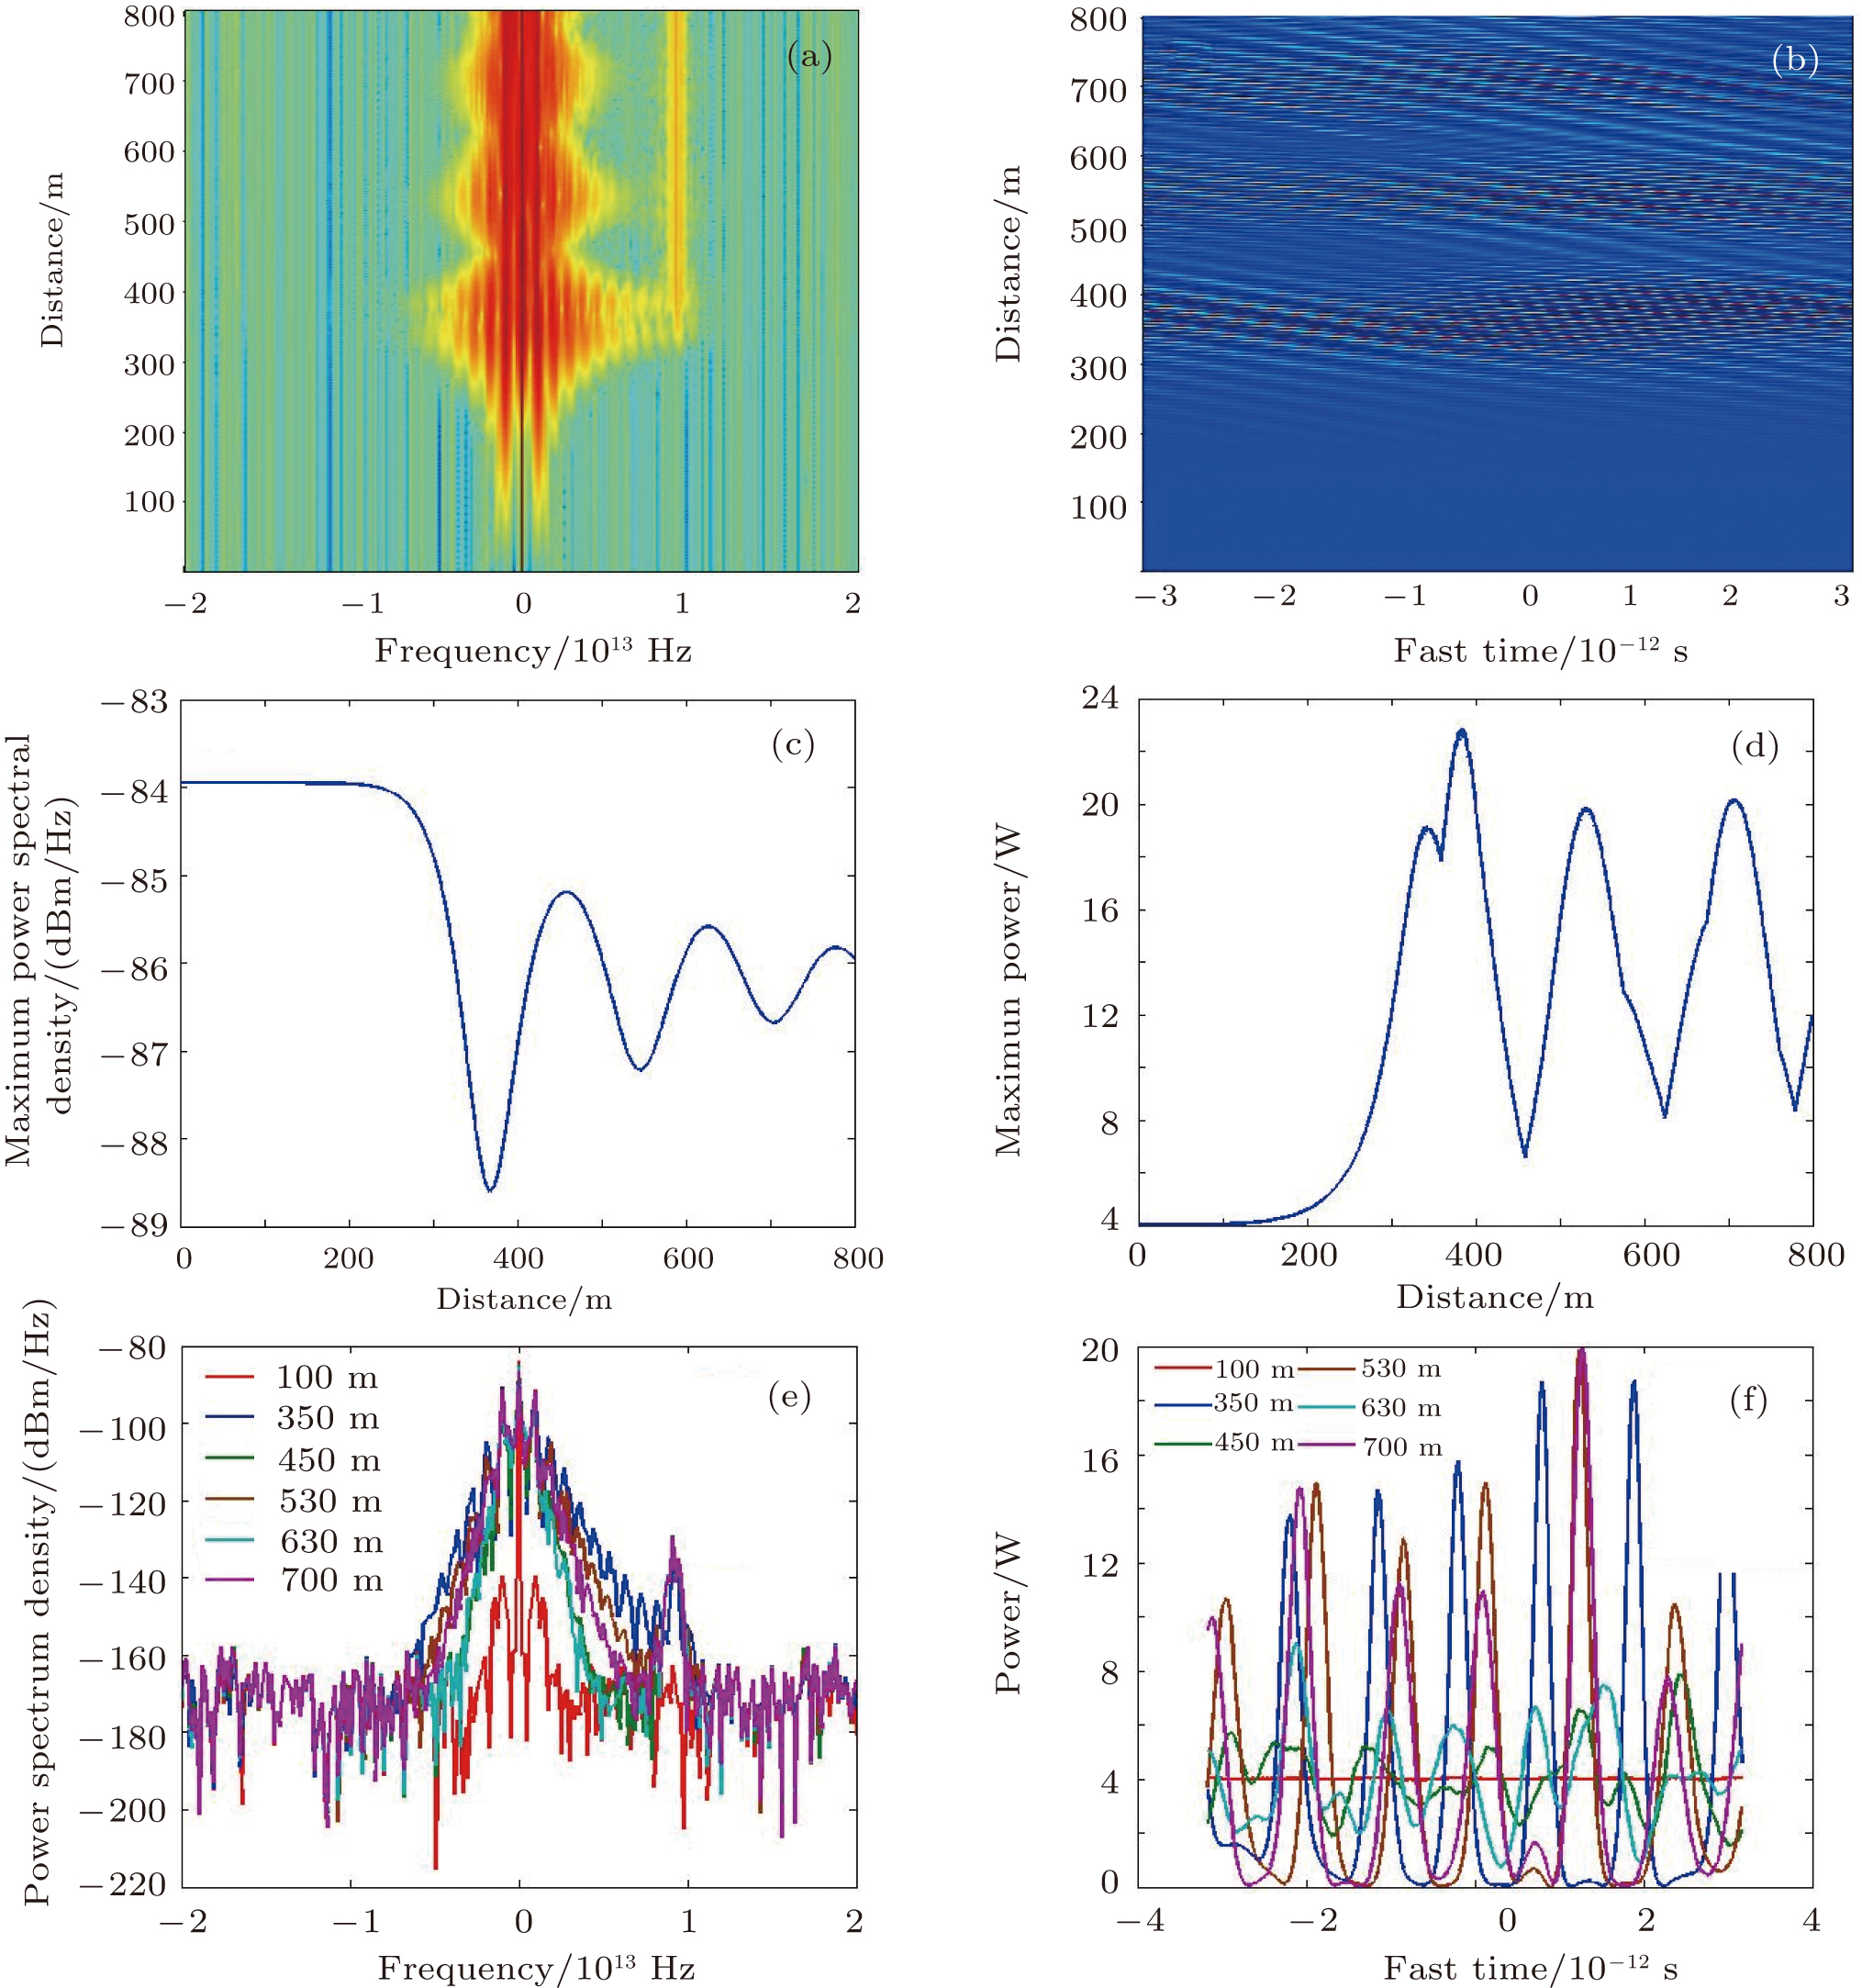
To be clear, the case without a probe serving as the input is investigated primarily. Figure 2(a) shows the spectrum evolution with fiber length. There are three points to be concerned about. Firstly, MI begins to occur at the position of ∼ 100 m, where the two symmetric sidelobes become obvious. Secondly, it exhibits FPU recurrence as fiber length increases, which is the characteristic of MI. From its details it follows that MI is so strong that a multiple order of frequency peaks is present in the positions of ∼ 350 m, ∼ 530 m, and ∼ 700 m, while it becomes weak with fewer frequency peaks at the positions of ∼ 450 m and ∼ 630 m. Finally, DW emerges in the high frequency region and the DW angular frequency satisfies the phase-matching condition of .[1] Figure 2(b) shows the corresponding time-domain evolution with fiber length, where the transmissions of different pulses are clear. It can be found that the pulse power is much higher at the positions of ∼ 350 m, ∼ 530 m, and ∼ 700 m than at those of ∼ 450 m and ∼ 630 m, which indicates that the pulses also experience a periodical variation because of FPU recurrence.

Fig. 2. (color online) Simulation results for the case without a probe. Panels (a) and (b) show the spectral and time-domain evolutions with fiber length. Panels (c) and (d) exhibit the maximum evolutions of frequency and time domain with fiber length. Panels (e) and (f) are the spectra and time-domain waveforms at the positions of 100 m, 350 m, 450 m, 530 m, 630 m, and 700 m.

To get a better insight, the maximum evolutions of frequency and time domain with fiber length are shown in Figs. 2(c) and 2(d), respectively. It can be found that the minimal values are at the positions of ∼ 370 m, ∼ 540 m, and ∼ 700 m in the frequency domain, while in the time domain the values at the corresponding positions are maximal. On the contrary, the maximal values are at the positions of ∼ 460 m, ∼ 620 m, and ∼ 780 m in the frequency domain, while in the time domain the corresponding values are minimal. As mentioned above, a multiple phase-matched frequency peaks appear when MI effect is strong enough, leading to the decrease of pump power in the frequency domain. At the same time, the pulse peak power in the time domain increases due to the relation between frequency-comb-like structure and time-domain pulse shape. To prove this, the spectra and time-domain waveforms of several positions are selected and shown in Figs. 2(e) and 2(f). When MI is very weak (see the spectrum at the position of 100 m), it is close to a constant in the time domain which equals a pump power of 4 W. Furthermore, for the positions where frequency comb structure is obvious, such as 350 m, 530 m, and 700 m, the pulse shapes are quite regular with high peak power and low background, while the pulse shapes are distorted for the positions where fewer frequency peaks appear, such as 450 m and 630 m. It confirms again that the power conversion does exist in the process of fiber transmission. The period of the regular pulses is ∼ 1 ps, which is approximately the reciprocal of the frequency spacing between adjacent MI peaks.

3.2. With a probe outside MI resonance region

As mentioned in the theory section, the waveform first manifests itself as a pump-probe beat when the pump is accompanied by a probe outside the MI resonance region as the input, corresponding to the beginning part of the fiber. With the increase of fiber length, MI becomes significant gradually and the waveform evolves to the pulse shape. To confirm this, a probe with a power of 40 mW and a frequency spacing of 13.86 THz is used in the simulation and the results are shown in Fig. 3. As mentioned above, the MI resonance region of the pump without the effect of fiber attenuation is between zero and ±1.7 THz. When considering fiber attenuation, it can be found that the resonance region for the first-order MI is between zero and ∼ ±1.6 THz in Fig. 3. So the probe lies outside the MI resonance region. The used probe power also makes sure that MI will not occur for the probe. Figures 3(a) and 3(b) show the spectral and time-domain evolutions with fiber length in the presence of the probe, respectively, which are similar to those in Figs. 2(a) and 2(b). The few differences result from the random characteristic of the background noise. In spite of the differences due to random noise, the variation trends of these figures remain unchanged.

Fig. 3. (color online) Simulation results for the case with a probe outside MI resonance region. Panels (a) and (b) show the spectral and time-domain evolutions with fiber length. Panels (c) and (d) are the spectra and time-domain waveforms at the positions of 100 m, 200 m, 240 m, 280 m, and 350 m.

Figures 3(c) and 3(d) present the corresponding spectra and time-domain waveforms at the positions of 100 m, 200 m, 240 m, 280 m, and 350 m. From their details it follows that MI is very weak at the position of 100 m, which corresponds to the beat between the pump and the probe in the time domain. At the positions from 200 m to 280 m, it is apparent that MI becomes more obvious with more frequency peaks and higher power. Consequently, the time-domain shape evolves from the beat to a pulse train gradually. Finally, the frequency-comb-like structure is clear with a large number of frequency peaks, and the pulse shape becomes quite regular with the background close to zero at the position of 350 m. The time-domain waveforms at the positions of 100 m, 280 m, and 350 m are consistent well with the theoretical results shown in Figs. 1(a)1(c), respectively. To be emphasized, the period of the regular pulses is still ∼1ps, which is the same as the case without a probe. It indicates that the pulse train is caused by spontaneous MI, rather than the interaction between the pump and the probe. Therefore, as long as the probe lies outside the MI resonance region, it is impossible to adjust the generated pulse period by changing the pump-probe frequency spacing. Moreover, it should be noticed that the peaks around the probe in Fig. 3(c) result not from MI of the probe but from FWM between the pump, the probe and the MI peaks of the pump.

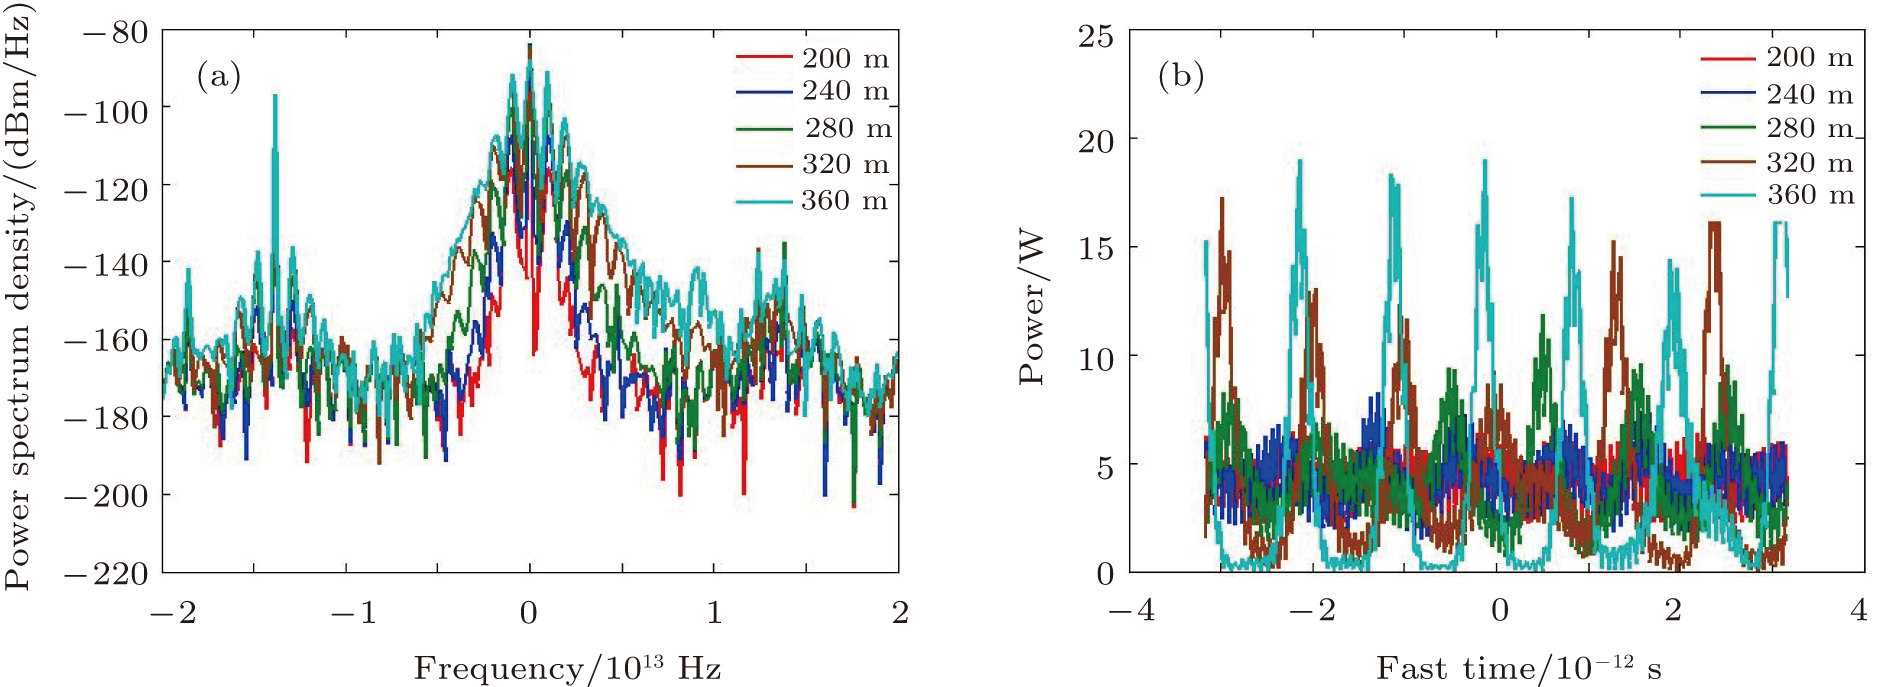
Moreover, the probe power is changed to 200 mW, with its frequency spacing unchanged. The corresponding spectra and time-domain waveforms at the positions of 200 m, 240 m, 280 m, 320 m, and 360 m are shown in Figs. 4(a) and 4(b). It can be found that the variation tendency is the same as those in Figs. 3(c) and 3(d). However, it should also be noticed that the probe has a more significant influence when it has a higher input power. For example, the pulse shape becomes regular at the position of 350 m for the probe power of 40 mW. On the contrary, for the probe power of 200 mW, the pulse shape is less regular with more burrs originating from the pump-probe beat even at the position of 360 m.

Fig. 4. (color online) Simulation results for a higher probe power outside MI resonance region. Panels (a) and (b) are the spectra and time-domain waveforms at the positions of 200 m, 240 m, 280 m, 320 m, and 360 m.
3.3. With a probe in MI resonance region

The case with a probe outside the MI resonance region has been presented, and the other case with the probe in MI resonance region will be investigated in detail hereafter, which is quite different from the above results. The frequency spacing of the probe is changed to 1.26 THz with the power of 40 mW. As mentioned above, the MI resonance region of the pump with considering the effect of fiber attenuation is between zero and ∼ ±1.6 THz, so the probe lies in MI resonance region. Figures 5(a) and 5(b) show the corresponding spectral and time-domain evolutions with fiber length, respectively. Comparing with Figs. 3(a) and 3(b), it can be found that the pulse train is very easy to occur in the whole fiber, which is due to the MI-induced FWM with many more frequency peaks. Furthermore, the period of FPU recurrence is ∼ 90 m, which is much shorter than that with the probe outside the MI resonance region. In other words, the power exchange between the pump and adjacent frequency peaks becomes more frequent when the probe lies in MI resonance region. This can be observed more clearly in Figs. 5(c) and 5(d), which show the maximum evolutions of frequency and time domain with fiber length, respectively. To get a better insight, the spectra and time-domain waveforms at the positions of 100 m, 200 m, 400 m, 600 m, and 800 m are presented in Figs. 5(e) and 5(f)), where more frequency peaks and more regular pulses can be found. The result at the position of 200 m in Fig. 5(f) corresponds to the theoretical result shown in Fig. 1(d), where the pulse period difference is due to the difference in the pump-probe frequency spacing between Figs. 5(f) and 1(d). The period of the pulses changes to ∼ 0.8 ps, which is close to the reciprocal of the frequency spacing between the pump and the probe. Thus the period of the generated pulse train can be adjusted by changing the pump-probe frequency spacing when the probe lies in the MI resonance region. To be noticed, for each of the FPU period, the pulse shape is still distorted at the positions where few MI peaks are present, such as the position of 600 m.

Fig. 5. (color online) Simulation results for the case with a probe in MI resonance region. Panels (a) and (b) are the spectral and time-domain evolutions with fiber length; panels (c) and (d) are the maximum evolutions of frequency and time domain with fiber length; panels (e) and (f) are the spectra and time-domain waveforms at the positions of 100 m, 200 m, 400 m, 600 m, and 800 m.
4. Application analysis

As is well known, MI has been used to generate ultra-short pulses. From the above analysis, there are some points that one should pay attention to. First, in the absence of the probe, the pulse train appears after propagating through a certain fiber span, and the pulses become regular and distorted alternately due to the phenomenon of FPU recurrence. Second, when the probe lies outside the MI resonance region, the beat between the pump and the probe and the pulse train resulting from spontaneous MI emerge one after another with a transition region in between. The probe power also has an influence on this transition region. Third, when the probe lies in MI resonance region, the pulse train is much easier to occur with more regular pulse shape because of MI induced FWM, and the period of the pulses equals the reciprocal of the frequency spacing between the pump and the probe.

The above results are extremely guidable for the practical applications of pulse train manipulations. Primarily, the period of the generated pulse train depends on the position of the probe in the spectrum. When the probe lies outside the MI resonance region, the period corresponds to the reciprocal of frequency spacing of spontaneous MI, while it is inversely proportional to the frequency spacing between the pump and the probe only when the probe lies in MI resonance region. Thus the probe must be located in MI resonance region to realize the adjustment of the pulse train period. In addition, FPU recurrence is always present and its period differs when the probe lies in and outside the MI resonance region. The special positions with fewer frequency peaks should be excluded where the generated pulses are distorted.

5. Conclusions

In this paper, the evolution of optical pulse in nonlinear fiber has been investigated theoretically and numerically with a pump and a probe serving as the input. It can be divided into two cases, i.e., the probe lies - outside the and in MI resonance region. For the former case, it is found that the time-domain waveform transits from the pump-probe beat to the pulse train gradually. The period of the pulse train equals the reciprocal of the frequency spacing of spontaneous MI rather than the spacing between the pump and the probe. For the latter case, it is found that the regular pulse train is easier to occur with its period corresponding to the reciprocal of the frequency spacing between the pump and the probe instead. Thus the period of the generated pulse train can be adjusted by changing the pump-probe frequency spacing only when the probe lies in MI resonance region. The results obtained by numerical simulations accord well with the theoretical results.

Reference
[1] Agrawal G P 2007 Nonlinear Fiber Optics San Diego Academic Press
[2] Wang H L Yang A J Leng Y X 2013 Chin. Phys. 22 074208
[3] Zhong X Q Cheng K Xiang A P 2013 Chin. Phys. 22 034205
[4] Tai K Hasegawa A Tomita A 1986 Phys. Rev. Lett. 56 135
[5] Tai K Tomita A Jewell J L Hasegawa A 1986 Appl. Phys. Lett. 49 236
[6] Grosz D F Fragnito H L 1998 Microwave Opt. Technol. Lett. 18 275
[7] Grosz D F Mazzali C Celaschi S Paradisi A Fragnito H L 1999 IEEE Photon. Technol. Lett. 11 379
[8] Liu X M 2011 J. Lightwave Technol. 29 179
[9] Chen W Meng Z Zhou H J 2012 Chin. Phys. 21 094215
[10] Mussot A Kudlinski A Kolobov M Louvergneaux E Douay M Taki M 2009 Opt. Express 17 17010
[11] Chen W 2013 Influences and Suppression Techniques of Nonlinear Effects on Long-Haul Interferometric Fiber Sensing Systems Ph. D. Dissertation Changsha National University of Defense Technology in Chinese
[12] Leo F Hansson T Ricciardi I De Rosa M Coen S Wabnitz S Erkintalo M 2016 Phys. Rev. 93 043831
[13] Droques M Barviau B Kudlinski A Taki M Boucon A Sylvestre T Mussot A 2011 Opt. Lett. 36 1359
[14] Van Simaeys G Emplit P Haelterman M 2002 J. Opt. Soc. Am. 19 477
[15] Soto-Crespo J M Ankiewicz A Devine N Akhmediev N 2012 J. Opt. Soc. Am. 29 1930
[16] Alem M Soto M A Thévenaz L 2015 Opt. Express 23 29514