Equilibrium dynamics of the sub-Ohmic spin-boson model under bias
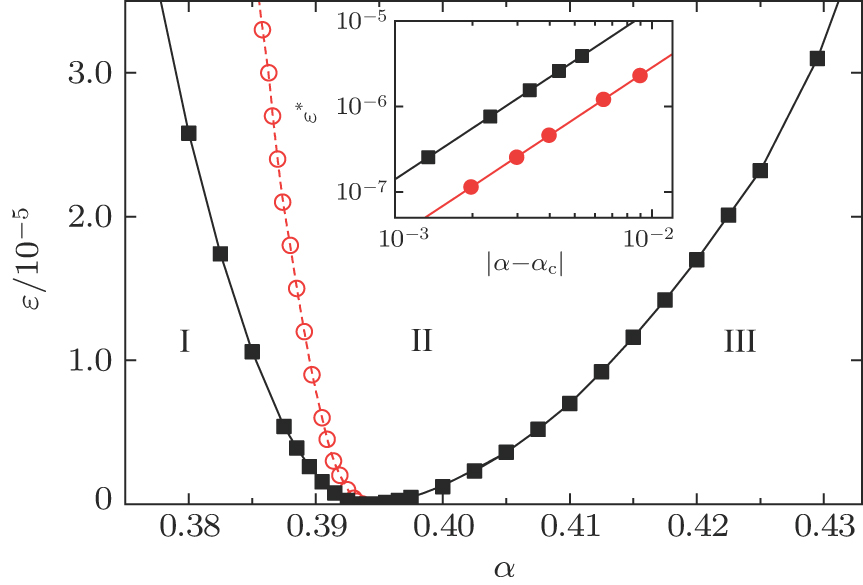
(color online) Phase diagram of sub-Ohmic SBM near QCP extracted from C(ω). Regions I, II, and III are the delocalized, quantum critical, and the localized phases, respectively. They are separated by a crossover line (solid squares with eye-guiding line) at which the peak height of C(ω) drops to 90% of its ε = 0 value. The peak height of C(ω) reaches maximum at the dashed line with empty circles. Inset: log-log plot of 


