|
Xue Shan1, 2, Du Hong-Chuan1, 2, †, Yue Sheng-Jun1, 2, Wu Hong-Mei1, 2, Hu Bi-Tao1, 2, ‡
|
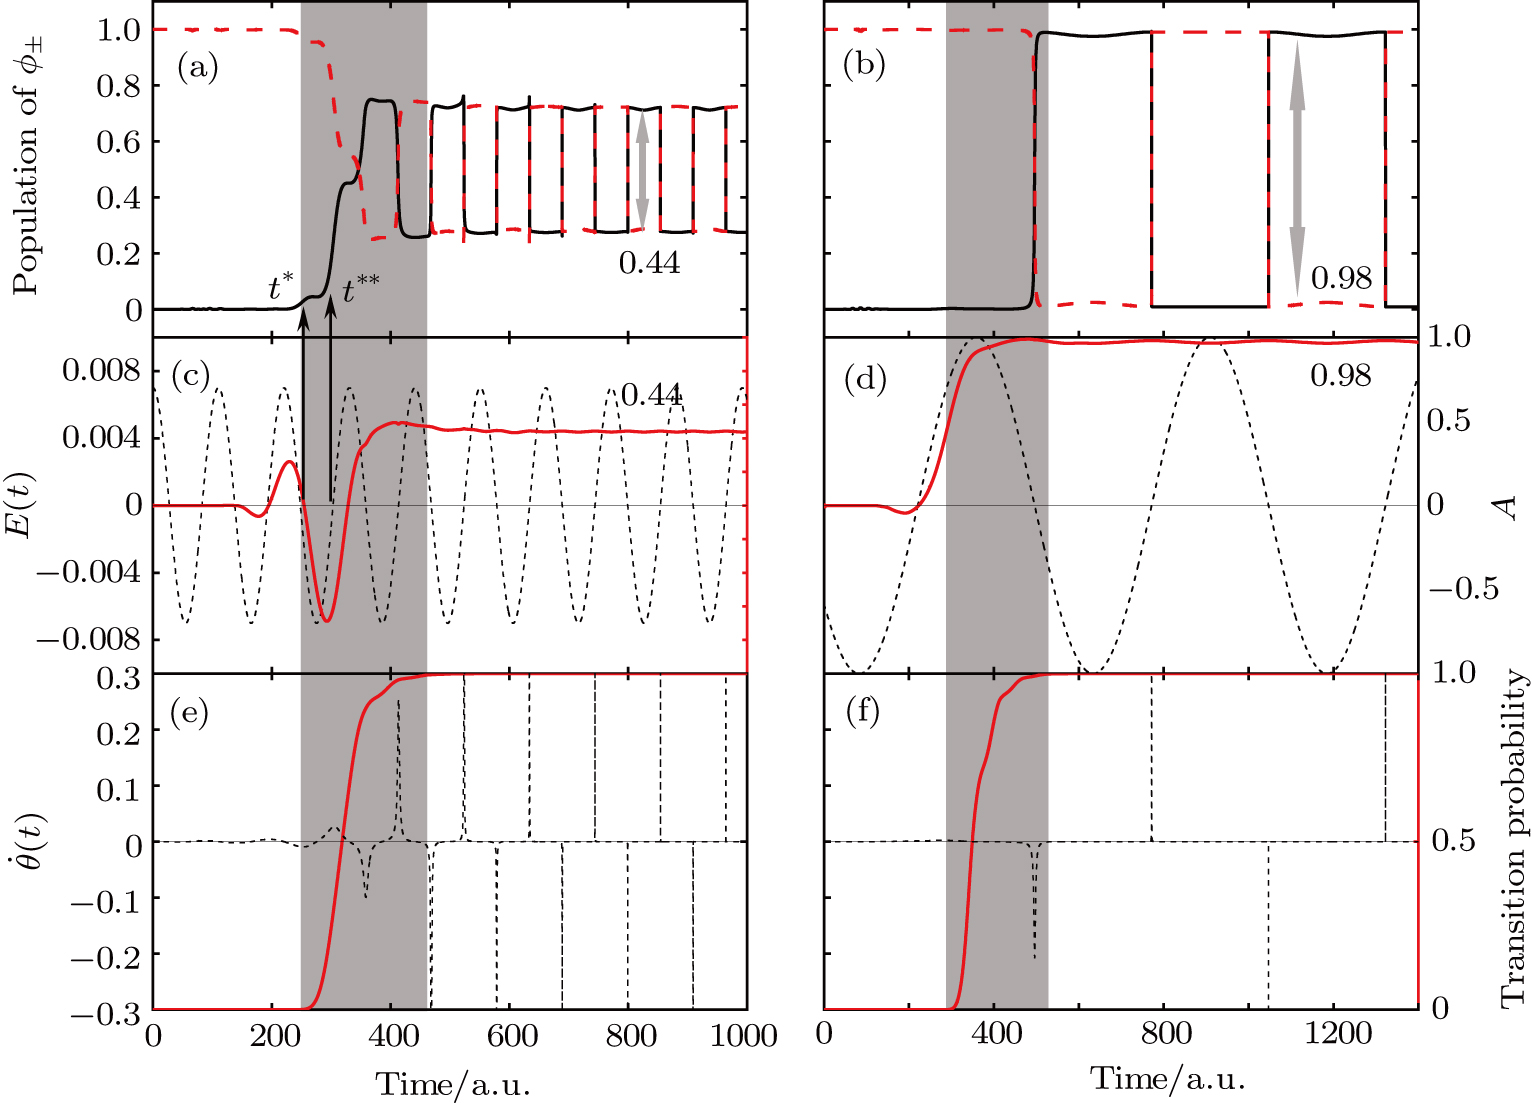
(color online) (a), (b) The time-dependent population of ψ+ (black solid lines) and ψ− (red dashed lines). (c), (d) The LAPs (red solid lines) are calculated using Eq. (7). (e), (f)
 (black dotted lines) and the transition probability (red solid lines) of ψ± are derived from the main nuclear trajectory (black dotted lines) and the transition probability (red solid lines) of ψ± are derived from the main nuclear trajectory
 . The electric fields E(t) (black dotted lines) are also given in panels (c) and (d) for clear identification of the zero crossings. The grey region covers the value of the transition probability from 0.1% to 99.9% calculated by Eq. (12). Panels (a), (c), and (e) are for 800 nm, and panels (b), (d), and (f) are for 4000 nm. . The electric fields E(t) (black dotted lines) are also given in panels (c) and (d) for clear identification of the zero crossings. The grey region covers the value of the transition probability from 0.1% to 99.9% calculated by Eq. (12). Panels (a), (c), and (e) are for 800 nm, and panels (b), (d), and (f) are for 4000 nm. |