† Corresponding author. E-mail:
A novel method for measuring differences of microstructure by advanced use of the Faraday magneto-optical effect is proposed. Two groups of YAG laser welds on Q235 have been investigated in order to compare MO imaging and traditional methods. Microstructure images have been compared with MO images, and MO diagrams display different colors and gray scales for the base metal, the weld zone, and the heat affected zone. Experimental results indicate that the welded joint microstructure can be inspected by MO imaging without metallographic preparation.
Laser welding is a complicated technique with wide applications in manufacturing.[1,2] During welding, various microstructures inevitably occur, caused by different welding parameters, and the properties of metal materials after welding, such as strength, toughness, and thermal input tend to be affected by their microstructure. Hence, differences in microstructure play a crucial role in evaluating quality after welding.[3,4] Several techniques have been employed during the last few decades as efficient methods to reveal the microstructure of the weldment, e.g., classical metallographic grain analysis based on chemically etched surfaces with scanning acoustic microscopy,[5] metallographic microscopy, and scanning electron microscopy methods,[6] as well as detection by electron beam scattering diffraction and x-ray diffraction imaging.[7,8] In this article, a novel magneto-optical (MO) imaging detection method of analysis by Faraday MO effect is proposed and experimented.[9,10]
The Faraday MO effect is a phenomenon in which polarization of incident light is rotated to an angle θ under the effect of an external magnetic field.[11,12] The angle θ can be described as
 |
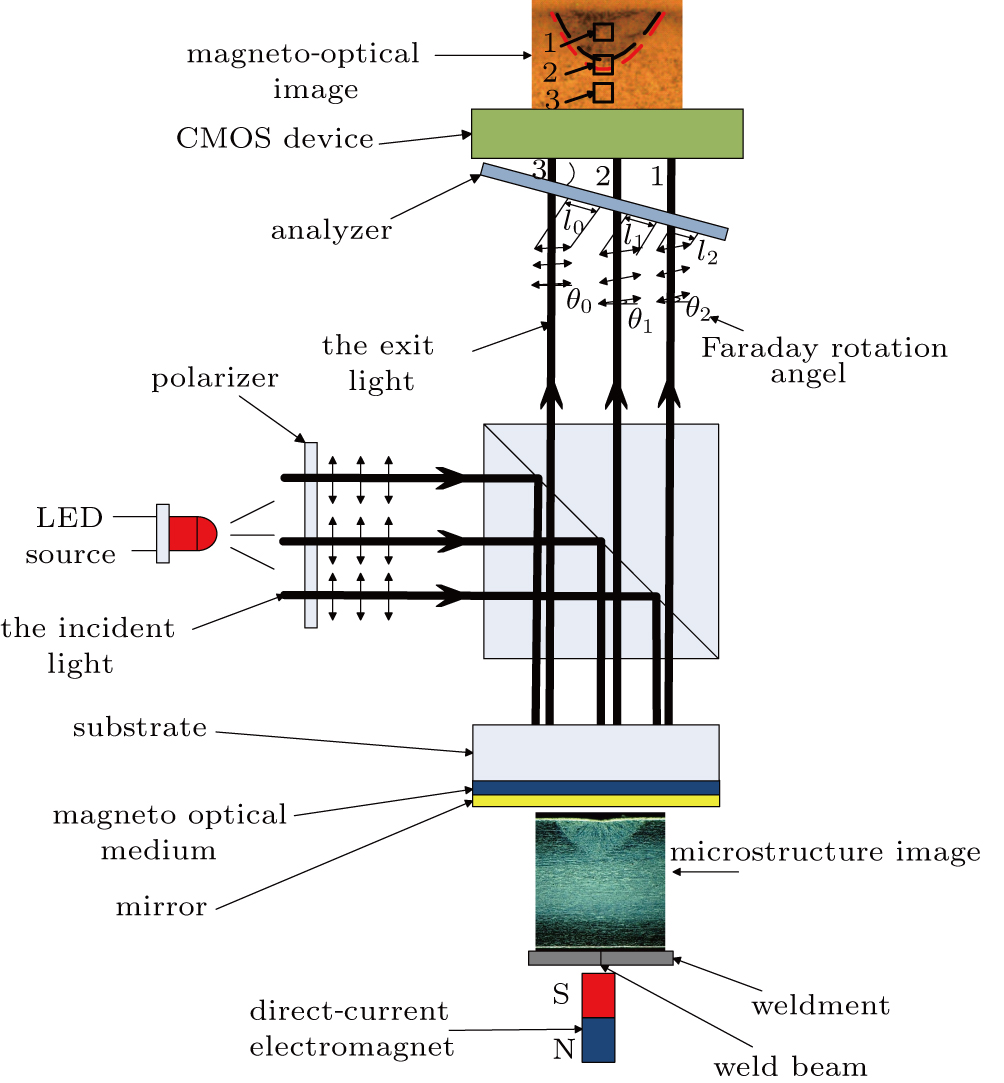
A schematic diagram of the experimental setup is shown in Fig.
The incident light is emitted by a light emitting diode (LED) and is polarized when passing through a polarizer. The weldment is magnetized by the direct-current electromagnet, and the induced magnetic fields change the magnetic state of the MO film. As the polarized light passes through the substrate and active MO medium twice, a Faraday rotation is produced in the polarized light. Then the polarized light is analyzed by the analyzer placed in the path of the exiting light, and lastly the optical contrast corresponding to the rotation is captured by an imaging device (CMOS camera). Only when the magnetic field direction is parallel to the direction of the incident light can a rotation be induced in the polarized light, and the variation of brightness can show up in an MO image.
When the linearly polarized light passes through the MO film where the magnetic field exists, the amplitude of the linearly polarized light projected on the analyzer can be described as
 |
The corresponding light intensity 

 |
 |
 |
The corresponding regions in the MO image of 


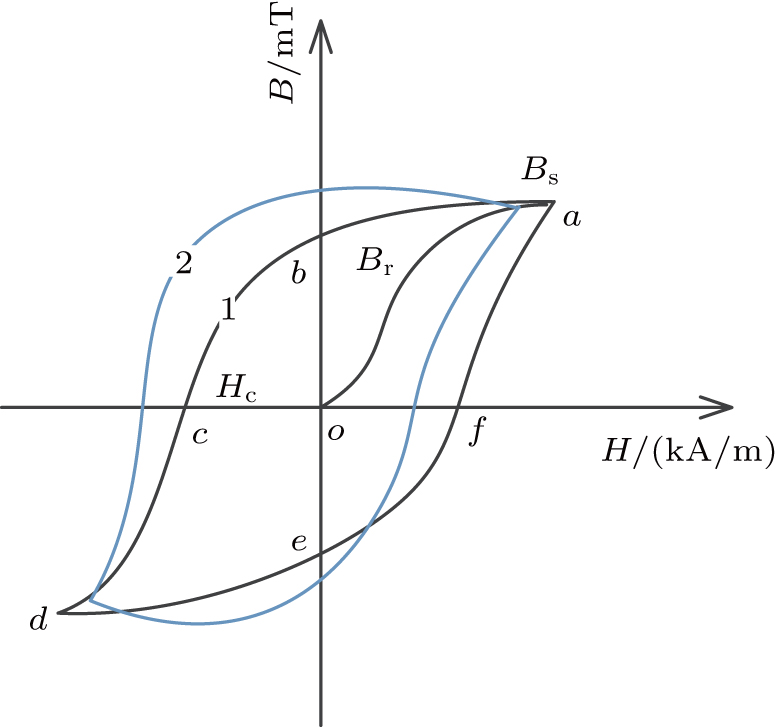
Q235 is a kind of ferromagnetic material whose element atoms have quite a strong magnetic moment. As shown in Fig.
As the intensity of the external magnetic field H increases from 0, the magnetization intensity B of the weldment is gradually enhanced. As shown in Fig.
 |


There is a great deal of difference between the welded joint and the base steel after welding. The welded joint can be classified to one of several zones based on differences of microstructure.[18–20] MO imaging on account of materials’ electromagnetic properties is an effective method to identify those differences.
Metal material Q235 with a length of 100 mm, width of 60 mm, and thickness of 2 mm was welded by an Nd: YAG laser welding equipment under argon atmosphere with a flux of 27 L/min. The chemical composition of Q235 is shown in Table
| Table 1.
Chemical composition of Q235 (wt.%). . |
| Table 2.
Welding parameters of groups A and B. . |
As can be seen in Fig.
 | Fig. 3. (color online) Hysteresis loop. The change from curve 1 to curve 2 represents the grain size decreasing. |
The experiments of butt plate welding were performed with an Nd:YAG laser welding machine. Weldments were cut by a metallographic cutting machine. As the metallographic specimens, the polished weldments were etched by using a solution of 1 ml nitric acid and 19 ml ethanol. Furthermore, the weldment's microstructure was investigated by the optical microscope. The MO setup was employed to acquire MO images of the welded joint section and surface.
In Fig.
The same result can be found in the MO image of the welded joint section. Region 1 is black and circled by a blank arc. Region 2 is between a red arc and the black arc, but is in light brown. Region 3 is the all orange area covering the outside of the red arc. Regions 1–3 respectively represent the WZ, the heat affected zone (HAZ), and base metal (BM). As the microstructure images show, there is a considerable amount of fine ferrites and pearlites in the WZ, whose distribution is dense and inhomogeneous. On the other hand, the grains in the HAZ are coarse and distributed inhomogeneously. The base metal area, consisting of ferrites and pearlites, is the largest of the three regions, and the ferrites and pearlites are distributed homogeneously.
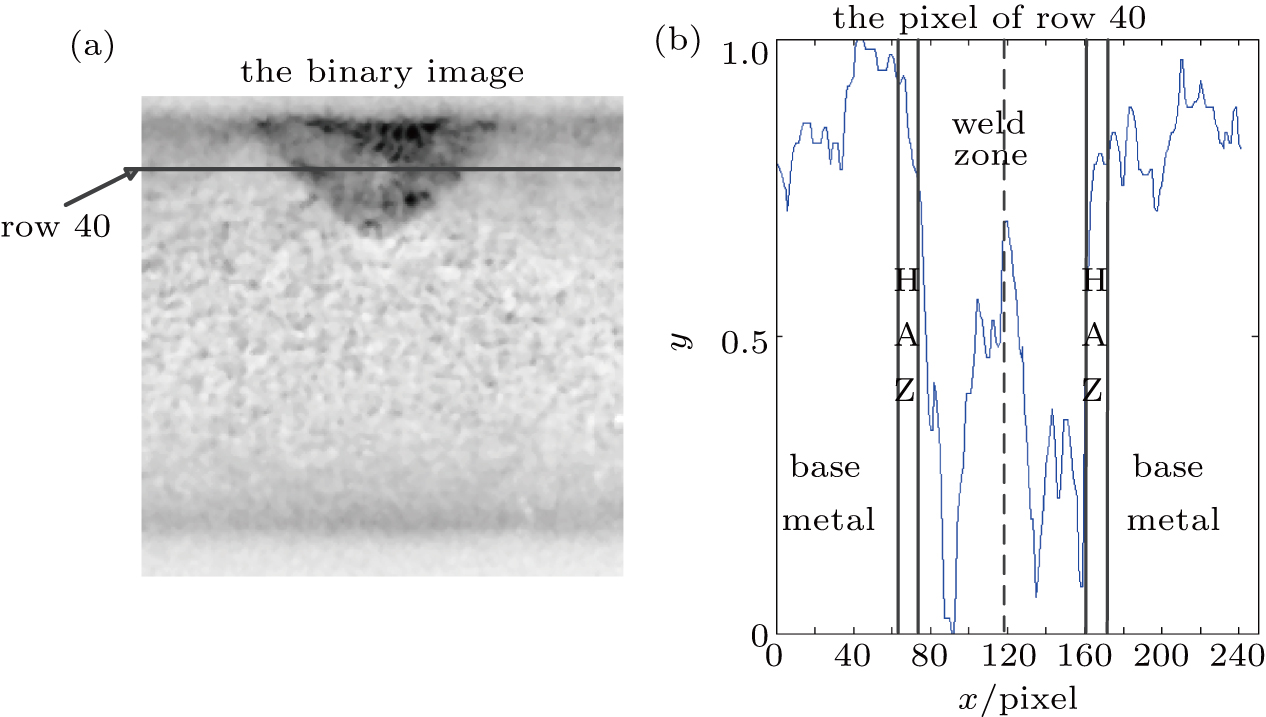
Figure
 | Fig. 6. (color online) Image processed diagrams of weldment A. (a) Binary image of weldment B. (b) Curve indicating the gray scales of row 40 in panel (a). |
When the weldment was put into the magnetic field caused by the direct-current electromagnet, the weldment was magnetized. Then the direct-current electromagnet was taken away, and the residual magnetism 


 |
 |
 |
 |
 |
 |
Parameter S is defined as the grain size; 


When an MO sensor is used to capture the MO image, the magnetic state of the magnetic medium is changed by the residual magnetic field in the weldment, and the Faraday rotation of the polarized light is induced. The change corresponds to the distribution of light intensity and shadow in the MO image. Since 
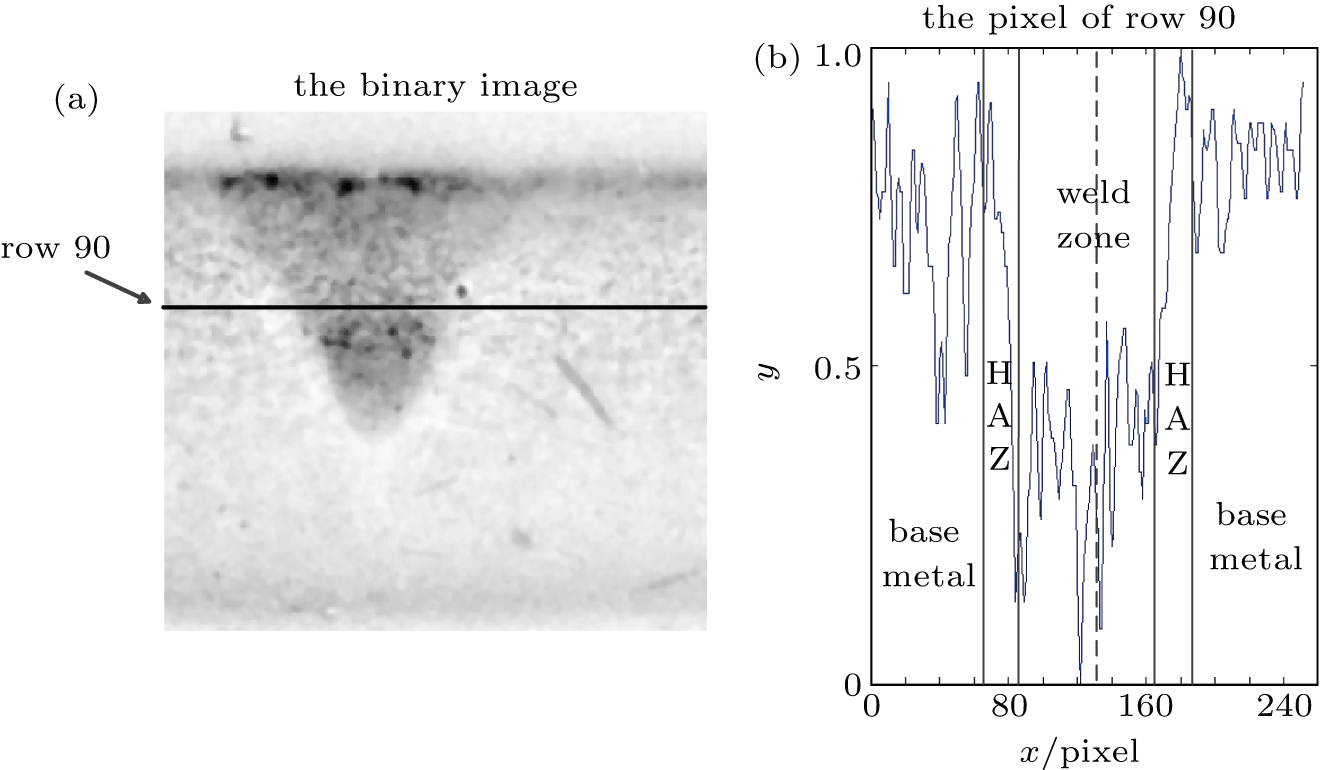
Another group of experiments for weldment B yielded similar results. A change in average power caused the thermal input to increase. As exhibited in Figs.
 | Fig. 7. (color online) Diagrams of different regions (1, 2, 3) of weldment B (real image of the welded joint, magneto-optical image of the welded joint section and surface, microstructure image). |
 | Fig. 8. (color online) Processed diagrams of weldment B images. (a) Binary image of weldment B, treated by the contrast stretched method. (b) Curve indicating the gray scales of row 90 of panel (a). |
| Table 3.
Different |
On the other hand, there are differences between weldment A and weldment B. When the average power changes for weldment B, the widths of WZ and HAZ increase, in which the thermal input is enhanced, unlike weldment A. During laser welding, microstructures are refined better at higher temperature, thus the grain sizes of weldment B are smaller than those on the corresponding regions of weldment A. According to the results in Table
Two Q235 weldments, welded under different welding parameters, were studied. A novel microstructure detection method using the MO imaging technology was investigated. The main conclusions are as follows.
The grain size has a significant influence on the magnetism of electro-magnetic materials. The permeability of materials decreases and the coercivity increases as the grain size decreases. This makes the material hard to demagnetize, so greater residual magnetism remains.
Microstructure deformation obviously affects magnetism of materials. The key in material magnetization is the change of inner magnetic domain. High temperature causes some definite deformation of the microstructure of a welded joint during laser welding, which improves the rotational resistance of the magnetic moment and the domain wall, making it difficult to demagnetize the material.
The grain size increases from WZ to BM due to fast solidification, which is opposite to the changes of the residual magnetism in those regions. In optical-magneto imaging, the greater residual magnetism, the darker the color, and the larger the gray scales.
The grain size is closely related to the differences between MO images, and the corresponding relations between them are very helpful in identifying the differences in microstructure. Accordingly, MO imaging is an efficient method for microstructure inspection of welded joints.
| [1] | |
| [2] | |
| [3] | |
| [4] | |
| [5] | |
| [6] | |
| [7] | |
| [8] | |
| [9] | |
| [10] | |
| [11] | |
| [12] | |
| [13] | |
| [14] | |
| [15] | |
| [16] | |
| [17] | |
| [18] | |
| [19] | |
| [20] |


