High pressure electrical transport behavior in SrF2 nanoplates
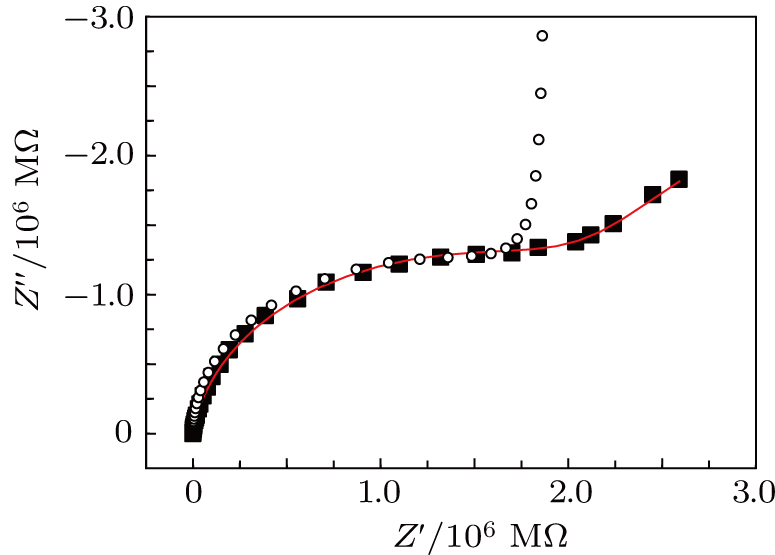
(color online) Nyquist diagram at 0.08 GPa. The solid square represents the experimental result. The circle represents the result with only F 

High pressure electrical transport behavior in SrF2 nanoplates |
|
(color online) Nyquist diagram at 0.08 GPa. The solid square represents the experimental result. The circle represents the result with only F |
 |