1. IntroductionMolecular high-order harmonic generation (MHHG), as one of the most important and potential tools to explore the electron dynamics in molecules and to obtain the coherent EUV and x-ray pulses, has been extensively investigated during the last two decades.[1–6]
Generally, the harmonic generation from an atom can be explained by the three-step model of the ionization–acceleration–recombination.[7] Compared with the atomic target, the molecular one is very complicated where the electron can recombine not only its parent nucleus but also other nucleus, thus resulting in some particular phenomena in the molecular harmonic spectrum, such as the destructive interference structure on the harmonic emission,[8] the interference minimum on the harmonic spectrum,[9] the asymmetric ionization,[10] and the multi-channel harmonic emission.[11–13] Undoubtedly, the contributions of the two nuclei to the MHHG play an important role in molecular dynamics and become a subject of great concern. For instance, Zhang et al.[14,15] theoretically investigated the spatial distribution in H driven by the THz controlling field. Pei and Miao[16] theoretically investigated the contributions of the two nuclei to the harmonic generation in H
 . Du et al.[17] theoretically investigated the harmonic spatial distribution in N2 molecule driven by the orthogonally polarized two-color field. More recently, Zhang et al.[18] theoretically investigated and demonstrated that the spatial distribution of MHHG in HeH
 can be affected by changing the phase of the laser field.
Thus, in this paper, we investigate this interesting issue of the laser phase effect on the spatial distribution of the MHHG in H . We find that when the laser phases are chosen from 0.0π to 0.6π and from 1.7π to 2.0π, the contribution from the negative-H plays the main role in harmonic generation. When the laser phases are chosen from 0.7π to 1.6π, the contribution from the positive-H to the harmonic generation is remarkably enhanced and becomes greater than that from the negative-H. Isotope investigation shows that the asymmetric harmonic distribution can be reduced by introducing the heavy nucleus (i.e., D
 .
.
2. Theoretical methodsNon-Bohn–Oppenheimer time-dependent Schrödinger equation (NBO-TDSE) for H can be expressed as[19–22]
where
is the Coulomb potential of H

,
R and
z denote the nuclear and the electronic coordinates,

and

are the reduced mass of the electron and the nucleus, where
m1 and
m2 are the mass of the two nuclei, respectively. The detailed parameters can be found in Ref. [
20].
The dissociation channels or the electron localizations (ELs) at the end of the laser field can be expressed as,[19,20]
where
and

a.u.

means the ELs of the positive-H (

and the negative-H (

(

nuclei. Asymmetry parameter

can be expressed as

(

(
t), where

or

means a high degree of EL on the negative-H or the positive-H nuclei at the end of the laser field, respectively.
[23]Time-dependent-induced dipole accelerations can be achieved by[24]
MHHG spectra can be expressed as
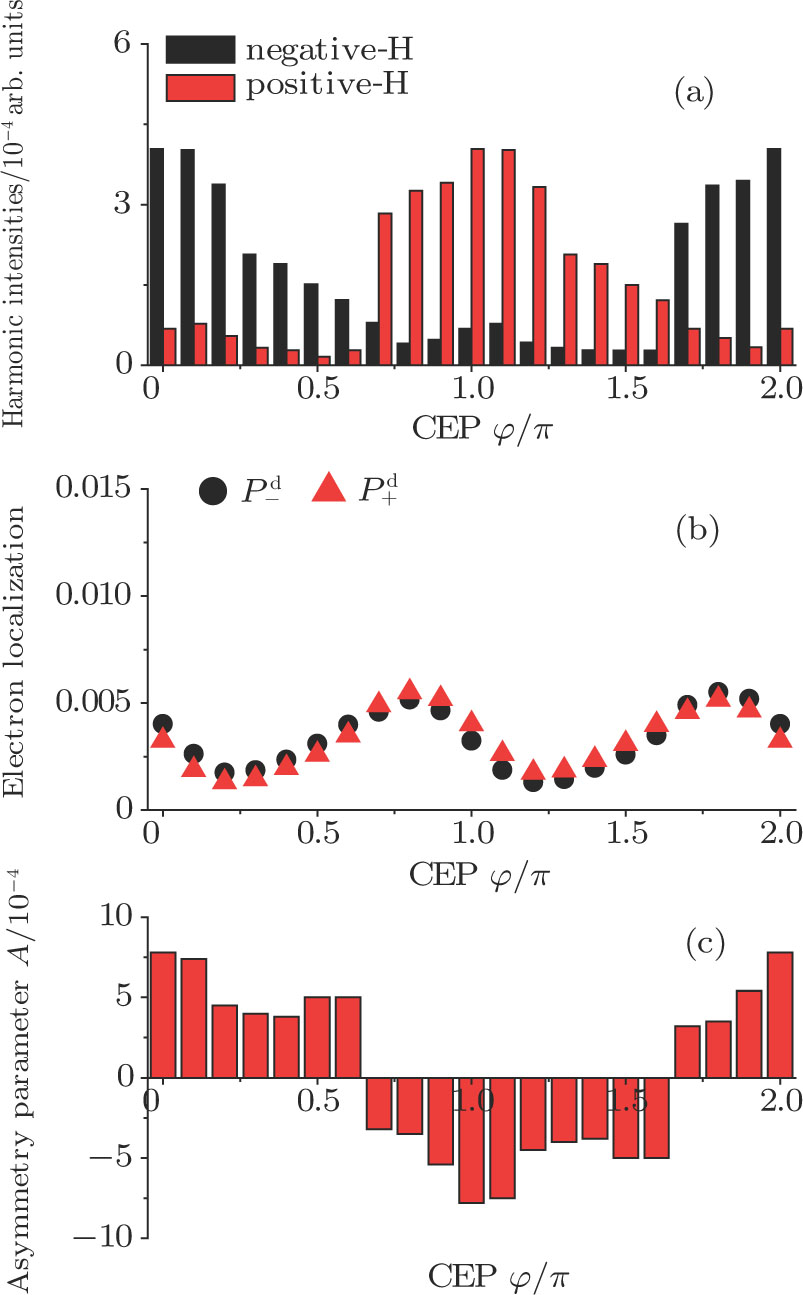
3. Results and discussionFigure 1(a) shows the laser phase effect on the distributions of the harmonic intensities (integrated over the last 10 harmonic orders near the cutoff region) from the two H nuclei. The laser field can be expressed as
where
ω1,
 τ
τ, and
φ are the laser frequency, the amplitude, the pulse duration and the carrier envelope phase (CEP) of the 5-fs/800-nm laser pulse. The laser intensity is

W/cm
2. Clearly, a periodic variation of the asymmetric distribution of the MHHG can be obtained in a region of 2
π. In particular, (i) when the laser phases are chosen from 0.0
π to 0.6
π and from 1.7
π to 2.0
π, the harmonic intensities from the negative-H are higher than those from the positive-H. (ii) When the laser phases are chosen from 0.7
π to 1.6
π, the harmonic intensities from the positive-H are remarkably enhanced and become higher than those from the negative-H. According to the ‘three-step’ model, the emission of the harmonic is caused by the acceleration and the recombination process between the electron and the parent ion. While for the case of H

, there are two parent ions, thus the electron can be localized and recollided on both of them. Therefore, if the electron prefers to localize on one of the two H nuclei, the probability of the harmonic emission from this parent ion will be enhanced. As a result, the intensities of the harmonic spectra from this parent ion should be enhanced. Thus, in Figs.
1(b) and
1(c), we present the ELs and the asymmetry parameters of H

as a function of the laser phase. It is found that asymmetry parameters are larger than zero when

[0.0
π, 0.6
π] and

[1.7
π, 2.0
π], which means that the electron is more localized on the negative-H. While when

[0.7
π, 1.6
π], the asymmetry parameters are smaller than zero, which means that the electron prefers to localize on the positive-H in these laser phases, which is responsible for the asymmetric distribution of the MHHG observed in Fig.
1(a).
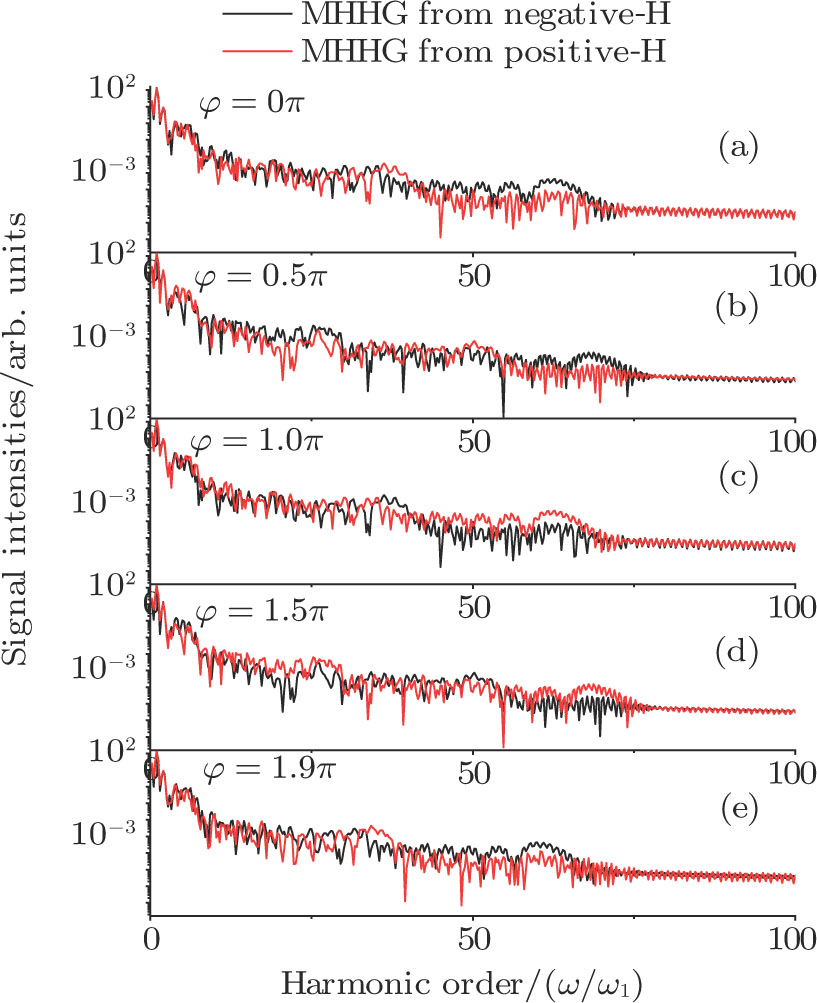
Figures 2(a)–2(e) show the distributions of the MHHG spectra from H for the cases of
  , 0.5π, 1.0π, 1.5π, 1.9π, respectively (where we use these five cases as examples to explain the asymmetric distributions of the MHHG with the variation of the CEP). As stated before, for the cases of
  and
and  , the contributions from the negative-H to the harmonic cutoff region play a main role in harmonic generation. For the cases of
  and
and  , the contributions from the positive-H to the harmonic cutoff region are higher than those from the negative-H. For the case of
  , the contributions from the negative-H to the harmonic cutoff region are enhanced and play a main role in MHHG once again. However, with the increase of the laser phase (starting at
  or
or  , the asymmetric distributions of the MHHG decrease compared with the scenarios for
  and
and  or
or  and
and  .
.
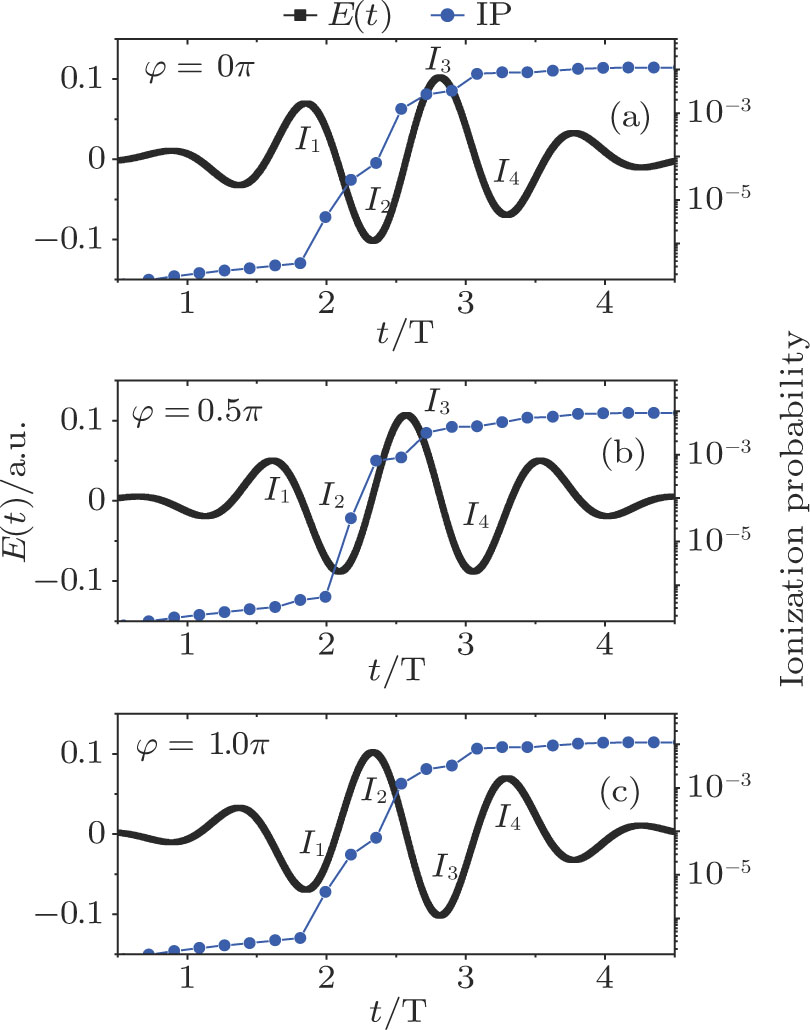
Figures 3(a)–3(c) show the laser profiles and the ionization probabilities (IPs) of H driven by the 5-fs/800-nm field with
  ,
,  , and
, and  , respectively. As we know, the emitted harmonics are attributed to the ionization–acceleration–recombination process during the interaction between the laser and the molecules. Particularly, the electron is first ionized near the peak of the laser field; then the free electron can be accelerated and drawn back to the parent core in the following half-cycle. Usually, the harmonic emission process occurs at each half cycle. Thus, through analyzing Fig. 3, we see that there are four main enhanced ionization times (corresponding to four harmonic emission processes), marked as Ii (
 –4), for the cases of
  ,
,  , and
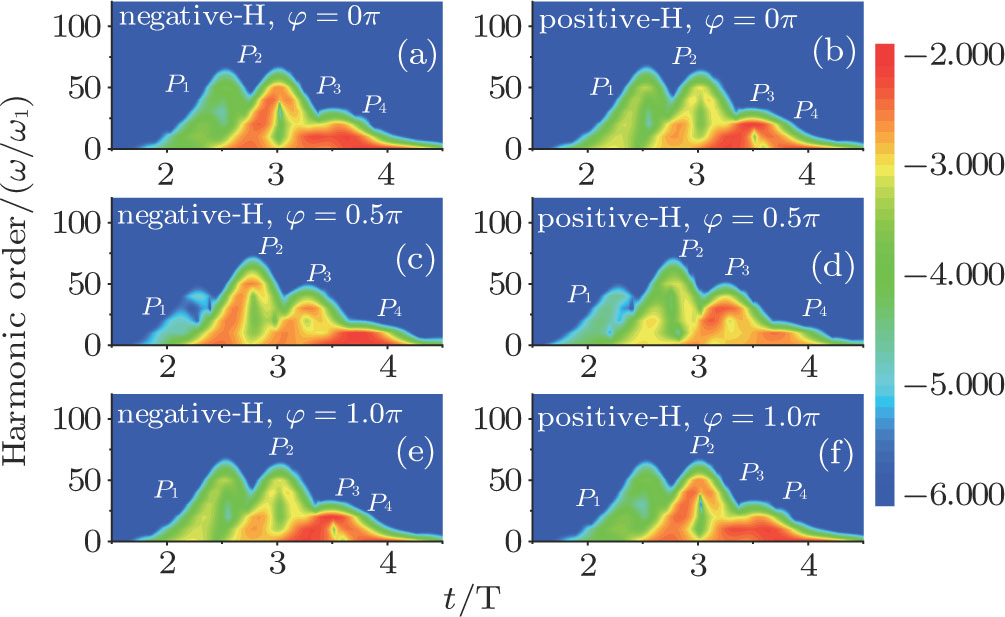
, and  . To better understand the molecular harmonic emission process, in Figs. 4(a)–4(f), we present the time-frequency analyses of the MHHG[25] for the cases of
  ,
,  , and
, and  , respectively. We see that there are four harmonic emission events in the molecular harmonic emission process marked as Pi, and the emission time is in accord with the ionization–acceleration–recombination process illustrated in Fig. 3. However, for the cases of
  and 1.0π, due to the fact that the ionized electron can receive the similar recombination energies from 3.0 T to 3.5 T (after the third enhanced ionization) and from 3.5 T to 4.0 T (after the fourth enhanced ionization), thus we cannot distinguish the harmonic emission events of
  and P4 in Figs. 4(a), 4(b) and 4(e), 4(f). In detail, for the case of
  , the intensity of P1 from the positive-H is higher than that from the negative-H; the intensity of P2 from the negative-H is higher than that from the positive-H; and the intensities of P3 and
  present the similar contributions from the two nuclei as shown in Figs. 4(a) and 4(b). However, due to the lower IP around the first ionization time I1 (see Fig. 3(a)), the intensity of the harmonic emission event
  is too weak in comparison with the others, which is also responsible for the observed two harmonic plateau shown in Fig. 2(a). For the case of
  , due to the CEP effect (see Fig. 3(b)), there are four main harmonic emission events. The intensity of P1 from the positive-H is higher than that from the negative-H; the intensity of P2 from the negative-H is higher than that from the positive-H; and the intensities of P3 and P4 present the similar contributions from the two nuclei as shown in Figs. 4(c) and 4(d). For the case of
  , due to the fact that the laser profile is opposite to the case of
  (see Figs. 3(a) and 3(c)), the intensities of the harmonic emission events P1–P4 present the opposite contributions in comparison with the case of
  . Through analyzing Figs. 3 and 4, we see that when the laser field is larger than zero (
 ), the harmonic emission from the negative-H is higher than that from the positive-H (i.e., harmonic emission events of P2 or
  for the cases of
  , 0.5π or
  , respectively); while when the laser field changes its direction (
 ), the harmonic emission from the positive-H is higher than that from the negative-H (i.e., harmonic emission events of P1 or
  for the cases of
  , 0.5π or
  , respectively). These are the reasons behind the asymmetric distribution of the MHHG. Moreover, with the increase of the laser phase, the harmonic emission events from the two nuclei are increased, thus leading to the decrease of the asymmetric distribution of the harmonic intensity.
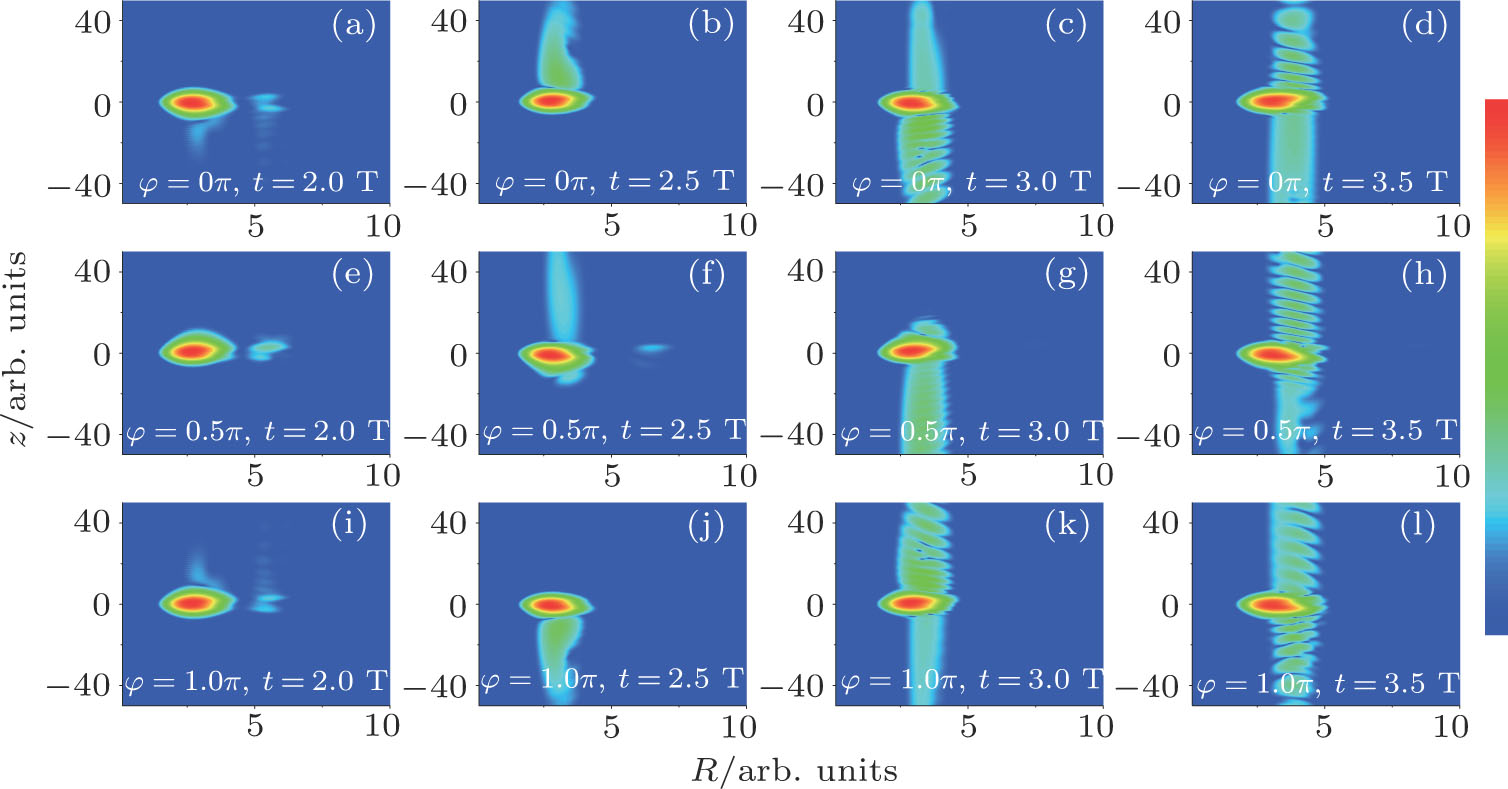
Figure 5 shows the time-dependent wave function  of H
of H . For the cases of
  and
and  as shown in Figs. 3(a)–3(d) and Figs. 3(e)–3(h), the electron prefers to localize on the negative-H at
  T (
T ( ). After a half cycle, the electron transfers to the positive-H at
  T (
T ( ). With further acceleration in the laser field, the electron can transfer to the negative-H ((
 )) and the positive-H ((
 )) at each half cycle. For the case of
  , the electron first ionizes along the positive-H at
  T (
T ( ). Then, it transfers to the negative-H (
 ) and the positive-H (
 ) at
) at  T and
T and  T. Finally, it returns back to the negative-H at
  T (
T ( ). The time-dependent electron motion is in agreement with the time-frequency analyses of the molecular harmonic distributions, that is, the electron more localizes on the negative-H when the laser field is larger than zero (
 ); and the electron prefers to localize on the positive-H when the laser field changes its direction (
 ).
).
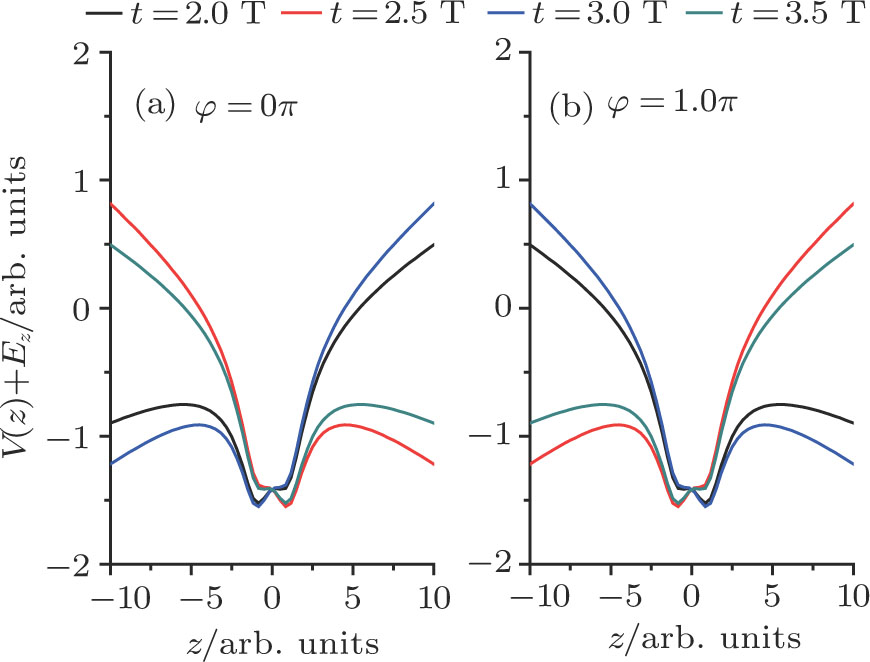
To better understand the attosecond-resolved electron motion in H , in Fig. 6, we present the dressed energies of H
 under the combined Coulomb and laser field potential. For the case of
  (Fig. 6(a)), due to the fact that the values of the laser field are larger than zero (
 a.u.;
a.u.;  a.u.) at
  T and
T and  T, the potential well of the negative-H decreases, thus leading to the increase of the EL around the negative-H at
  T and
T and  T. However, at
  T and
T and  T, the values of the laser field are smaller than zero (
 = -0.0468 a.u.;
  a.u.), thus resulting in the decrease of the potential well around the positive-H and the electron transfer from the negative-H to the positive-H. For the case of
  (Fig. 6(b)), the result is opposite, where the potential wells of the negative-H and the positive-H decrease at
  T,
T,  T and
T and  T,
T,  T, respectively. Clearly, the above analyses provide us with a potential method to control the spatial distribution of MHHG and the electron motion in H
 . For instance, if one wants to control the destructive interference structure or the interference minimum on the harmonic spectrum, caused by the multi-channel harmonic emission from different nuclei, one can just introduce a controlling pulse to modulate the laser values at each half cycle to control the electron motion around the two nuclei.
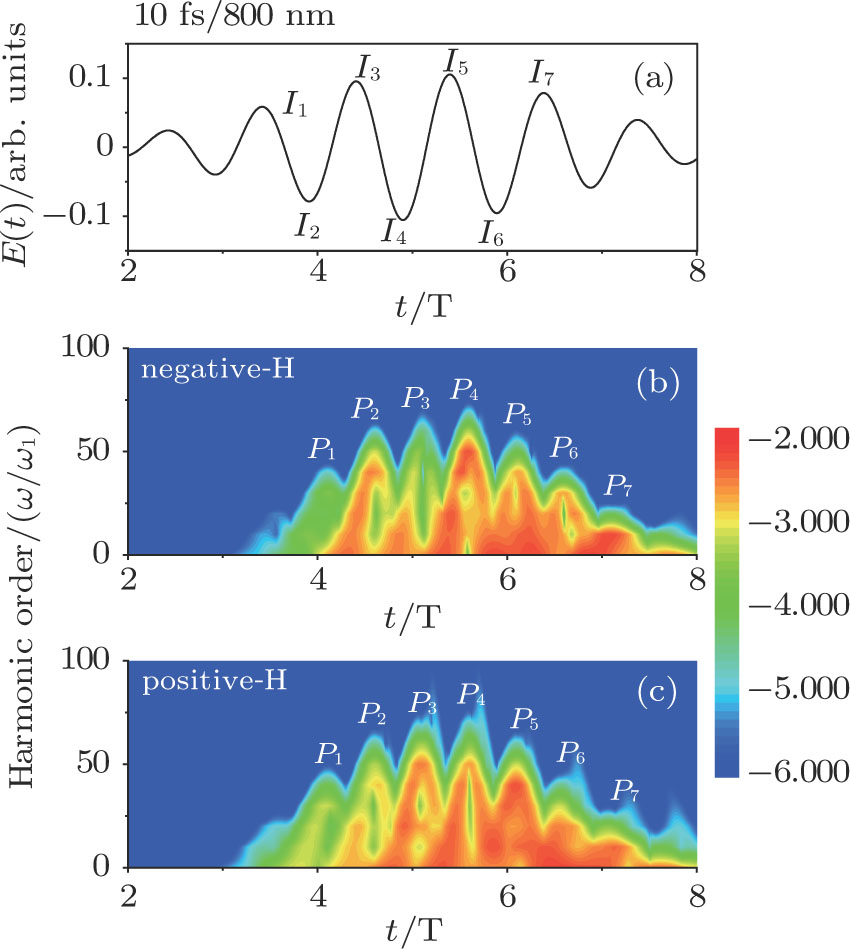
Figures 7(a)–7(c) show the distributions of the MHHG spectra from H driven by the 10-fs/800-nm multi-cycle pulses. The laser phases are chosen to be
  , 0.5π, and 1.0π, respectively. Clearly, with the increase of the pulse duration, the asymmetric distributions of the MHHG from the two-H nuclei decrease. This is because as the pulse duration increases, the profile of the laser field presents the symmetric characteristic and the ionization times near the peaks of the temporal amplitudes of the half-cycle increase (i.e., I1–I7) as shown in Fig. 8(a) for the case of
  . As a consequence, the harmonic emission events from the two H nuclei also increase, marked as
  , as shown in Figs. 8(b) and 8(c) for the case of
  , thus leading to the decrease of the asymmetric harmonic distributions from two H nuclei.
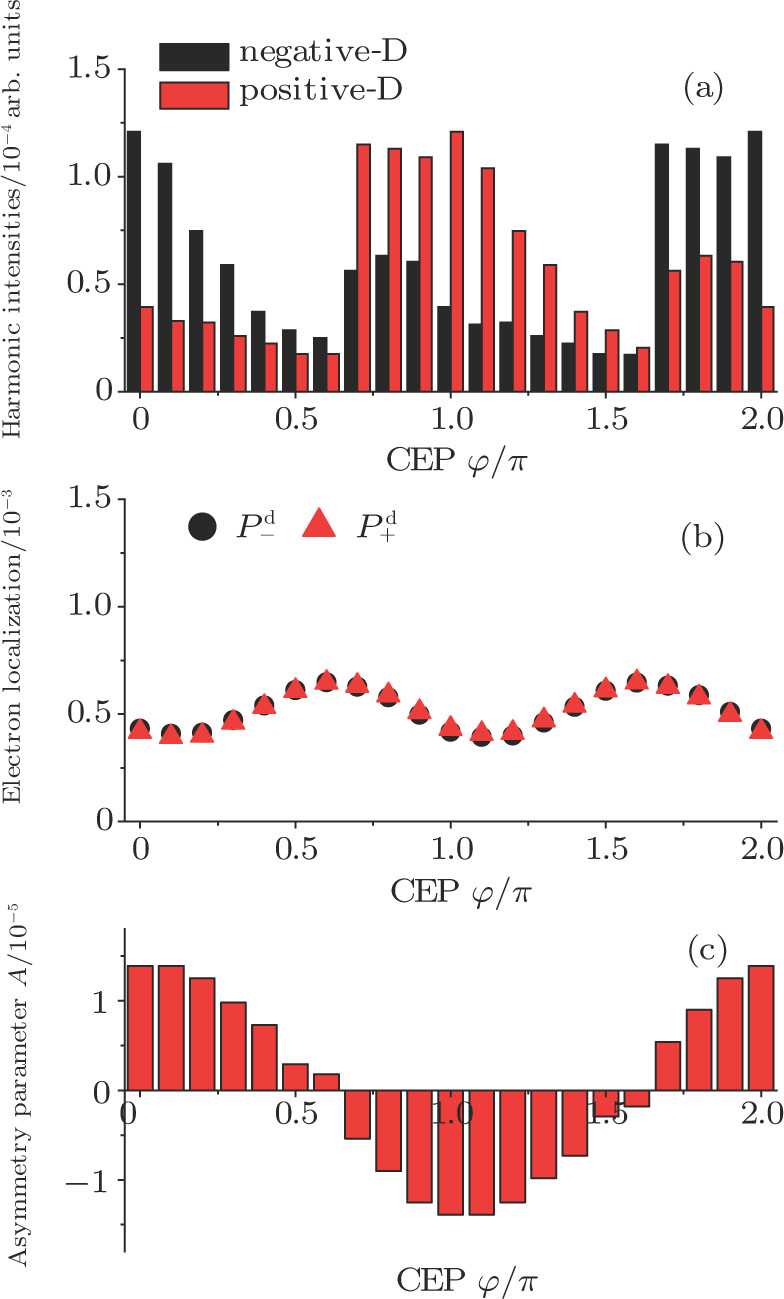
Figures 9(a)–9(c) show the isotope effects (i.e., D on the harmonic distributions, the ELs and the asymmetry parameters, respectively. Clearly, the periodic variation of the asymmetric distribution of the MHHG can also be obtained in D
 but with the lower harmonic intensities than in the case of H
 . Moreover, the comparison between Figs. 1 and 9 shows that the asymmetric spatial distributions of the MHHG, the ELs and the asymmetry parameters decrease as the mass of the nucleus increases.


