Pulse chirping effect on controlling the transverse cavity oscillations in nonlinear bubble regime
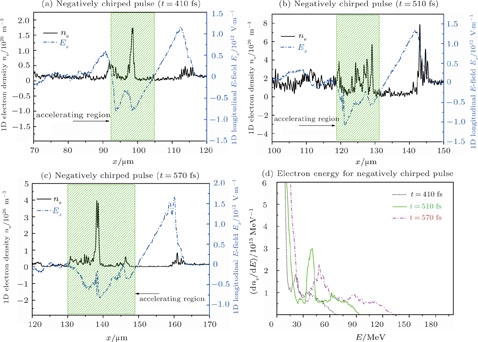
(color online) The superposition of one-dimensional (1D) diagrams of the wake field structure and plasma density during the propagation of the negatively chirped pulse in plasma at the times of: (a) t = 410 fs, (b) t = 510 fs, and (c) t = 570 fs. The blue curves show the electrostatic field of wake field and the black curves specify the density distribution of injected electrons. Also the green region determines the acceleration phase of the wake field. (d) The energy spectrum of injected electrons at the corresponding times of: t = 410 fs, t = 510 fs, and t = 570 fs.
