Probe gain via four-wave mixing based on spontaneously generated coherence
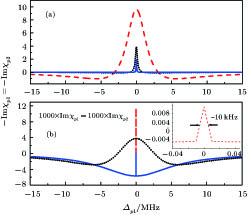
(color online) Probe gain spectra versus probe detuning 


Probe gain via four-wave mixing based on spontaneously generated coherence |
|
(color online) Probe gain spectra versus probe detuning |
 |