|
Zheng Ya-Rui, Xing Jian, Chang Yan-Chun, Yan Zhi-Guang, Deng Hui, Wu Yu-Lin, Lü Li, Pan Xin-Yu, Zhu Xiao-Bo †, Zheng Dong-Ning ‡
|
|
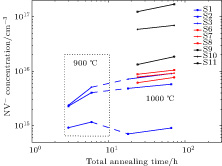
(color online) Plots of NV concentration versus total annealing time. Datum points in dash line box are measured after annealing at 900 °C, which are for first two annealing processes of S1–S3 as shown in the Table 1. Other datum points are measured after annealing at 1000 °C. Almost all the NV concentrations, expect S1, increase as the annealing time increases. The reason why S1 does not increase with the annealing time is unknown for the time being. |
