|
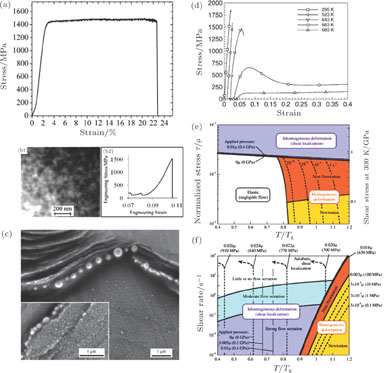
(color online) (a) Stress-strain curve of amorphous monolithic Pt
 Cu
Cu
 Ni
Ni
 P
P
 .[152] With permission from Physical Review Letters. Copyright 2004 American Physics Society. (b1) HAADF image of Pd
 Ni
Ni
 P
P
 phase separated BMG; (b2) stress-strain curve of Pd
 Ni
Ni
 P
P
 phase separated BMG.[183] (c) Scanning electron micrographs showing details of shear bands after local melting of the tin coating. The inset shows the shear-band pattern and tin beads located in regions removed from the large shear offset shown at the top of figure.[185] With permission from Nature Materials. Copyright 2006 Nature Publishing Group. (d) Effect of temperature on the uniaxial stress-strain behavior of Vitreloy 1 at a strain rate of

 and temperatures T = 295, 523, 643, 663, and 683 K. The stress–strain curves have been shifted to the right to avoid overlapping curves of similar shapes and sizes.[191] With permission from Acta Materialia. Copyright 2003 Elsevier. Deformation map for MGs in (e) stress–temperature and (f) strain rate–temperature axes. The absolute stress values shown are for the specific glass Zr
 Ti
Ti
 Cu
Cu
 Ni10Be
 .[138] With permission from Acta Materialia. Copyright 2007 Elsevier.
|


