Two-center interference in high-harmonic generation of

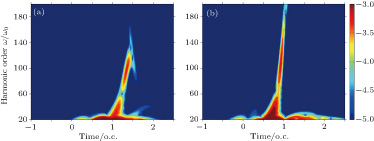
(color online) Time-frequency distributions of the HHG corresponding to the black solid curves in Figs.

Two-center interference in high-harmonic generation of 
|
|
(color online) Time-frequency distributions of the HHG corresponding to the black solid curves in Figs. |
 |