† Corresponding author. E-mail:
‡ Corresponding author. E-mail:
Project supported by the National Basic Research Program of China (Grant No. 2013CB932804), the National Natural Science Foundation of China (Grant Nos. 91227115, 11421063, 11504431, and 21503275), the Fundamental Research Funds for Central Universities of China (Grant No. 15CX02025A), and the Application Research Foundation for Post-doctoral Scientists of Qingdao City, China (Grant No. T1404096).
The peptide KI4Kwas synthesized on a CEM Liberty microwave synthesizer by using the standard Fmoc solid phase synthesis strategy. The Rink amide resin was used in order to allow the C-terminus to be amidated and then the N-terminus was capped with acetic anhydride before cleavage from the resin. The detailed information for the synthesis and purification procedures have been described in our previous work.[1] The purity of the final products was ascertained bymatrix-assisted laser desorption/ionization time-of-flight mass spectrometry (MALDI-ToF) and reversed-phase high-performance liquid chromatograph (RP-HPLC) analyses, indicating high purities (98%).
The peptide fluffy powder was dissolved in Milli-Q water and acetonitrile mixture to create solutions with the concentration of 16 mM. The suspension was sonicated for about 10 min and then the resulting homogenous solutions were incubated for 7 days at room temperature before further characterization.
AFM measurements were performed on a commercial NanoscopeIVaMultiMode AFM (Digital Instruments, Santa Barbara, CA) in the tapping mode. Samples for this characterization were prepared by dropping about 10-μL aged peptide solution onto the freshly cleaved mica surface and allowed to adsorb for about 30 s. The mica surface was then gently rinsed with water and dried by nitrogen gas. The scan rate was set to 1.50 Hz with the scan angle of 0°. All images were flattened by using a first-order line fit (the flatten function in AFM software) to correct for piezo-derived differences between scan lines.
The SANS experiments were performed on LOQ, ISIS Neutron Facility, Rutherford Appleton Laboratory (Oxford, UK). Samples for this experiment were prepared by directly dissolving the peptide powder in D2O/CD3CN mixture. The resulting homogenous solutions were incubated for 7 days and then transferred into the 2.0-mm path length disc-shaped silica cells for further characterization. Neutron incident wavelengths were from 2.2 Å to 10.0 Å at 25 Hz. The 64-cm2 detector with 5-mm resolution was placed at a distance of 4.05 m from the samples, giving a wave vector (
Details of our simulation are listed in the following tables (Table
| Table S1. Numbers of components and the relation between two ratios in different simulation systems. . |
| Table S2. Average areas of shells around the proto-fibril in different distances. . |
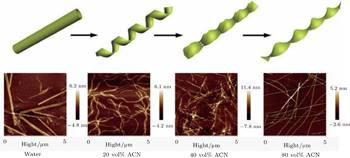
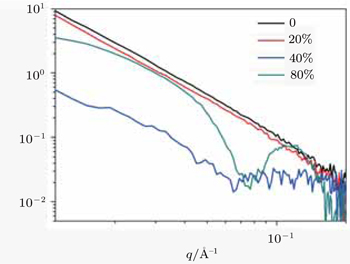
The experimental results of the acetonitrile effects are plotted in the following figures (Figs.
 | Fig. S1. AFM pictures of self-assembled KI4K structures in the solutions with different acetonitrile contents. |
| 1 |


