Filamentation instability in two counter-streaming laser plasmas
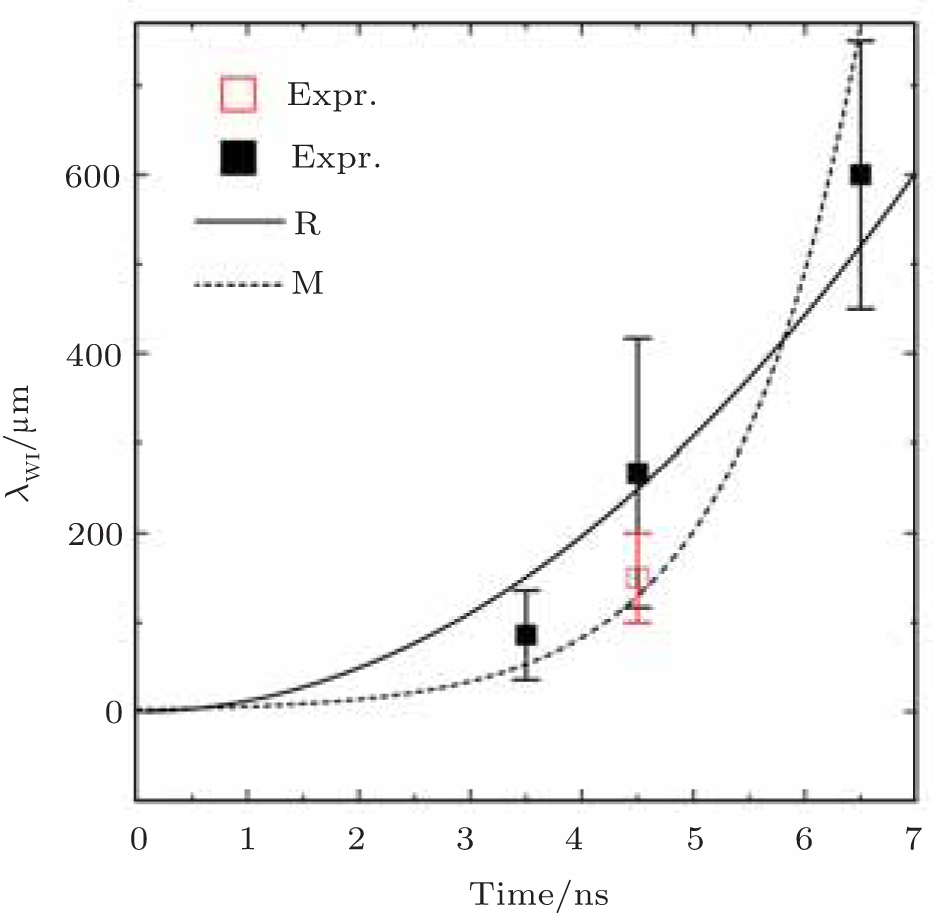
The temporal evolution of the current filament widths. Scattered symbols are experimental data with the error bar showing the width range. The solid line is from Medvedev’s model, and the dashed line from Ruyer’s model. For the time delay at 4.5 ns, two data points represent the two correlation scales derived from Fig.

