Array gain for a conformal acoustic vector sensor array: An experimental study
Wang Yong1, Yang Yi-Xin2, †, , He Zheng-Yao2, Lei Bo2, Sun Chao2, Ma Yuan-Liang2
School of Mechanical Engineering, Xi’an Jiaotong University, Xi’an 710049, China
School of Marine Science and Technology, Northwestern Polytechnical University, Xi’an 710072, China


† Corresponding author. E-mail: yxyang@nwpu.edu.cn

Project supported by the China Postdoctoral Science Foundation (Grant No. 2016M592782) and the National Natural Science Foundation of China (Grant Nos. 11274253 and 11604259).

Abstract
Abstract

An acoustic vector sensor can measure the components of particle velocity and the acoustic pressure at the same point simultaneously, which provides a larger array gain against the ambient noise and a higher angular resolution than the omnidirectional pressure sensor. This paper presents an experimental study of array gain for a conformal acoustic vector sensor array in a practical environment. First, the manifold vector is calculated using the real measured data so that the effects of array mismatches can be minimized. Second, an optimal beamformer with a specific spatial response on the basis of the stable directivity of the ambient noise is designed, which can effectively suppress the ambient noise. Experimental results show that this beamformer for the conformal acoustic vector sensor array provides good signal-to-noise ratio enhancement and is more advantageous than the delay-and-sum and minimum variance distortionless response beamformers.

1. Introduction

Vector sensors can make use of more available acoustic information than the scalar pressure sensors (e.g., hydrophones), because they can measure the components of particle velocity and the acoustic pressure at the same point simultaneously.[13] Consequently, the performance of a vector sensor array in terms of signal-to-noise ratio (SNR) enhancement, directivity, and localization accuracy, will be superior to that of the same aperture array consisting of scalar pressure sensors. Because the advantages are attractive, the vector sensor technology has grown rapidly in recent decades and it has been applied in many fields such as communication, geo-acoustic inversion, underwater imaging, and so on.[47] As the signal processing techniques of the vector sensor array can be included into the classical theoretical framework of scalar pressure sensor array, the existing beamforming methods and direction-of-arrival (DOA) estimation algorithms can be extended to vector sensor arrays.[1,811]

Array gain (AG) is defined as the difference between SNR of the output signal and SNR of the input signal of an array, which is an important parameter for measuring the detection performance of the array. When the source signal is a plane wave and the noise field is isotropic, the AG reduces to the directivity factor (DF). Cray and Nuttall[12] provided detailed calculations of the DFs of vector sensors and vector-sensing linear arrays and they also presented some comparisons with the scalar-sensing linear arrays. D’Spain et al.[13] analyzed the optimal AG and detection performance of vector sensor line arrays in a homogeneous, isotropic noise field. It is shown that vector sensors and vector sensor arrays can also provide superdirectivity or supergain in constraint of miniaturized aperture, but the basic principle is different from that for scalar pressure sensor arrays.[1416] Actually, the knowledge of the correlation structure of the noise always plays an important role in evaluating AG for a sensor array in a practical environment. Some models of the correlation structure under various environment assumptions have been developed for vector sensor arrays, which are useful to analyze the system performance before deployment.[17] However, the assumptions of the environment noise are not always in accordance with practical situation and the theoretical calculations will be sometimes not suitable, even degrade the performance of beamforming methods. For a specific array, the experimental measure is still an essential and direct way to evaluate its capability. In Ref. [18], the results of the minimum variance distortionless response (MVDR) method applying to process the actual data collected by the DIFAR array are presented. Wettergren and Traweek[19] studied the detection performance of a conformal velocity sonar array using a method of optimizing shading weights of the conventional beamformer. Some experimental results are also presented to demonstrate the feasibility of the proposed method. However, most of the previous works in relation to vector sensor arrays are limited to linear configurations, and the researches on the other type of vector sensor arrays are not sufficient.

This paper presents a detailed study of an experimental conformal acoustic vector sensor array in a practical environment, with particular focus on its AG. First, the manifold vector is calculated using the real measured data so that the effects of array mismatches can be minimized. Second, an optimal beamformer with a specific spatial response is designed using a direct optimization method, which can effectively suppress the ambient noise and improve SNR. The delay-and-sum (DAS) and MVDR beamformers are also designed for comparison. The weighting vectors of these beamformers are all calculated using the obtained manifold vector. The AGs of these different methods are calculated using experimental data and a detailed comparison is provided.

2. Background

An acoustic vector sensor simultaneously measures the components of pressure and two or three orthogonal particle velocities at the same point, which can be written as

where rm is the position of the m-th sensor, u = −[sin θ cos ϕ, sin θ sin ϕ, cos θ]T is the unit-length direction vector representation of an incident plane wave and Q is an orthogonal matrix which describes the orientation of the velocity channels.[17] The superscript T indicates the transpose. The wavenumber is k = 2π/λ, λ denoting the wavelength. The manifold vector will be

The manifold vector will be obtained using the experimental data in this study, so that the effects of array mismatches can be minimized. The actual manifold vector will be compared with the theoretical one in the following.

Let w be the weighting vector, then, the beampattern will be

where Ω0=(θ0,ϕ0) is the preset steering direction, the superscript H indicates the Hermitian transpose, θ and ϕ denote the elevation and azimuth angles, respectively.

3. Experimental setup

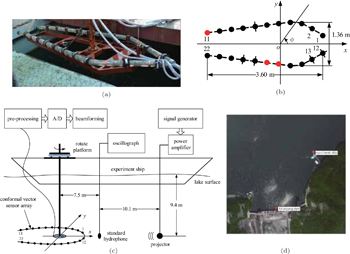
The experimental conformal array shown in Fig. 1(a) consists of 22 vector sensors and each vector sensor contains a pressure channel and two horizontal velocity channels. Unfortunately, three sensors (which are red in Fig. 1(b)) are not working in the experiment and only the data received by the remaining 19 vector sensors (57 channels) are used.

Fig. 1. Experimental conformal vector sensor array and configuration of experiment. (a) The photograph of the experimental conformal vector sensor array. (b) Top view of the conformal vector sensor array and coordinates. (c) Configuration of experiment. (d) Experiment location.

The experiment was carried out in a lake located at east China. As shown in Fig. 1(c), both the conformal vector sensor array and the projector were put at a depth of 9.4 m below the lake surface. The signals transmitted by the projector were rectangular window modulated single frequency continuous-wave pulses, which can be used to obtain the real manifold vector. The frequency is 3 kHz and the impulse repetition period was 10 ms. Note that there is a dam located in the southwest of the experiment ship and it will generate some noise, see Fig. 1(d). Some more detailed analyses of the ambient noise will be given below.

In the experiment, the array was rotated from 0° to 360° with a step of 3° in the horizontal plane to receive the signals, which is equivalent to the situation in which the signals were incident from these different directions. After the pre-processing, the received signals were sampled by A/D converters and the sample frequency was 16 kHz. The data from A/D converters were saved to a computer and processed off-line. The real manifold vectors P(ϕ) are calculated using the methods presented in Ref. [20], and they will be used to compute the weighting vectors of different beamformers. Because the real manifold vectors are obtained from the experimental data, the shadowing, scattering, and the near-field effects are all considered in this process. In other words, the weighting vectors computed using the real manifold vectors will be more accurate and efficient than that computed using the theoretical manifold vectors. This is also the reason why the real manifold vectors are always used in many applications, even though the measuring procedure is time-consuming.

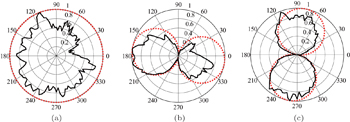
The amplitude responses of the 8th and 19th sensors at a frequency of 3 kHz are shown in Figs. 2 and 3, respectively. Theoretically, the pressure channel is omnidirectional and both of the two orthogonal velocity channels are the same with a dipole contour. However, the practical directivity responses are roughly in accordance with the ideal ones. Because the wavelength of the signal is analogous to the size of platform, and the apparent acoustic impedance contrast between water and materials of platform and vector hydrophone itself, the shadowing and scattering effects of these structures will inevitably cause some distortions. Specifically, it is seen that the amplitude responses in the direction of the vertical pole (see Fig. 1(a)) are clearly smaller than those in other directions due to the shadowing and scattering effects of this vertical pole. The amplitude responses of the other sensors also have the same properties which are not shown here for compactness.
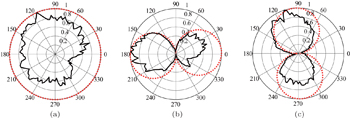
Fig. 2. Theoretical (dotted line) and practical (solid line) amplitude responses of the 8th sensor. (a) Pressure channel. (b) Velocity channel 1. (c) Velocity channel 2.
Fig. 3. Theoretical (dotted line) and practical (solid line) amplitude responses of the 19th sensor. (a) Pressure channel. (b) Velocity channel 1. (c) Velocity channel 2.

The directivity of ambient noise can be estimated using the MVDR method. The spatial spectrum is calculated using the following equation:[1]

where Rn is the noise covariance matrix, I is an identity matrix, ζDL is the diagonal loading value.

The noise covariance matrix Rn is estimated using the received noise data, which is expressed as

where n(l) is the noise-only vector and L is the number of training snapshots.

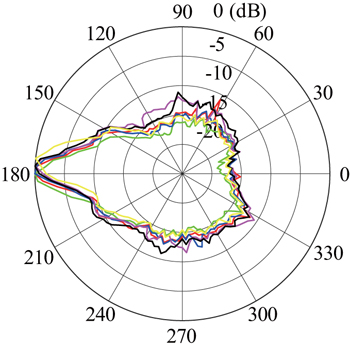
The obtained noise spatial directivity is shown in Fig. 4, in which only the narrow band noise with the center frequency of 3 kHz in six different time frames is used. The diagonal loading value ζDL is set to 0. Because there is a dam located in the southwest of the experiment ship, its noise will affect the directivity of ambient noise. As shown in Fig. 1(d), the dam is long and its noise that is generated from releasing water is stable in the experiment. Consequently, the directivity spectrum in ϕ ∈ [150°,210°] which is a relatively wide region is apparently larger than that in other angular regions and it was almost unchanging in the experiment, which means the ambient noise field was always not isotropic.

Fig. 4. Actual noise spatial directivity.

One of the methods than can reduce the effect of this anisotropic ambient noise field in the experiment is to design a suitable beamformer that can minimize the responses in ϕ ∈ [150°,210°] subject to some other constraints. The desired beamformer in this paper can be formulated as the following direct optimization problem:

where Ω0 is the preset steering direction, ΩSL1 is the sidelobe region in which the noise power is relatively large, and ΩSL2 is the sidelobe region excluding the mainlobe region and ΩSL1. The parameter δj is the prescribed sidelobe peak value, ζN is the specified upper bound of the norm of the weighting vector, and ‖·‖ denotes the Euclidean norm. The parameters in this paper are: Ω0 = (90°,0°), δj = 10−8/20, ζN = 10−8.5/10,

and

The optimization problem shown in Eq. (6) can be readily solved using a second-order cone programming toolbox such as SeDuMi.[21]

The beampatterns in Fig. 5 are obtained using the DAS, MVDR, and the proposed direct optimization methods, where the weighting vectors of the DAS and MVDR methods are expressed as

respectively.

Fig. 5. Actual beampatterns of different beamformers.

The mainlobes of the three beampatterns in Fig. 5 are almost the same, whereas the sidelobe levels (SLs) in ΩSL2 are clearly different from each other. The SLs of the direct optimization method are all below −8 dB, which satisfy the sidelobe constraint. By contrast, the highest SLs of the DAS and MVDR methods are approximately −5.2 dB and −3.4 dB, respectively, which are higher than that of the proposed method. Moreover, the SLs of the direct optimization in ΩSL1 are minimized to −32 dB, which is much lower than those of the DAS and MVDR methods. The performance of the direct optimization method in terms of the noise suppression and signal enhancement are better than the DAS and MVDR methods.

Three LFM signals with different input SNRs (which are spaced by 10 dB in turn) were transmitted for the purpose of evaluating the potential for AG enhancement of this conformal vector sensor array, and these signals were all incident from the direction of (90°,0°) in the experiment. Since the center frequency is 2.9 kHz and bandwidth is 200 Hz, the transmitted signals can be regarded as narrow-band signals. The beampatterns can be obtained using the weighting vectors calculated at the frequency of 3 kHz using the above-mentioned methods. Although this frequency is a little different from the signal center frequency, the effects are limited which are neglected. The signals received by the pressure channel of the 12th vector sensor are shown in Fig. 6(a), in which the actual SNRs of the three signals are 0.50 dB, 5.99 dB, 17.91 dB, respectively. Because the ambient noise was time-varying in the experiment, the SNRs of the received signals are not exactly spaced by 10 dB, but this difference will not affect the following AG results. Additionally, because the signal pulse width is a little large, some multipath signals will be included in experimental data. However, this work mainly focuses on comparing the performance of the DAS, MVDR, and the proposed direct optimization methods in terms of improving the AG under identical conditions. The effects of these multipath signals are just the same to these methods, and therefore they will not affect the final conclusions. A detailed study of the effects of multipath signals to the performance of different beamforming methods is needed but it is not the purpose of this work.

Fig. 6. Experimental results. (a) Signals received by the pressure channel of the 12th vector sensor. (b) Output signals of different beamformers corresponding to signal 1.

After the beamforming procedure, the output SNRs of different beamforming methods can be calculated using the following equation:

where is the power of the received data and is the power of the noise. This equation can also be used to calculate the input SNR. The final AGs are the difference between SNR of the output signal and SNR of the input signal, which are all listed in Table 1 and the output signals (corresponding to signal 1) are shown in Fig. 6(b). Since the SNRs of the channels are different from each other, the SNR of the pressure channel of the 12th sensor is selected, for simplicity, as the reference input SNR to compute the AG. It is noteworthy that the results listed in the first column of Table 1 are obtained only using the data received by the pressure channels of the 19 normal vector sensors. The other results are all achieved using the data received by three channels of these normal vector sensors.

Table 1.

AGs of different methods.

.

Because more information from the velocity channels is used, the DAS AGs computed using the data of three channels are larger than those obtained only using the data of pressure channels. Therefore, the vector sensor array can achieve higher AGs than the scalar sensor array with the same array size. As shown in Table 1, AGs of the DAS method are the smallest whereas AGs of the MVDR method are the largest among the results. Since the noise data that were used to obtain the noise covariance matrix were selected from the vicinity time of the signal pulses, they can be thought of as good estimations of the real noise data that were added to the signals. Consequently, the AGs of the MVDR method can be considered as the optimal ones that can be obtained in the corresponding circumstances. However, the performance of the MVDR method may degrade when the noise data used to estimate the noise covariance matrix contain the desired signal and the steering direction is different from the signal incident direction. Moreover, because the three signals were received in different time and the environment was time varying, the corresponding AGs achieved using the same method in the three cases are also different. However, the AG improvements of the MVDR method in comparison to the DAS method are all approximately equal to 6 dB. By contrast, the AGs of the direct optimization are enhanced by more than 2 dB over the DAS method, especially the AG enhancement in relation to signal 1 approaches 4.7 dB. Although the improvement is smaller than that of the MVDR method, the direct optimization method has no need to compute the noise covariance matrix so that it has no limitation when the noise data contain desired signals. In other words, the weighting vector of the proposed method is fixed whereas the weighting vector of the MVDR method should be adjusted when the noise covariance matrix is changed. Thus, the implementation of the direct optimization method is simpler than the MVDR method.

4. Conclusions

An experimental conformal array consisting of 22 vector sensors is designed, and its AG in a practical environment is studied in this paper. The manifold vector is calculated using the real measured data in the experiment so that the effects of array mismatches can be minimized. Then, the direct optimization, DAS, and MVDR beamformers are designed, and their weighting vectors are all calculated using the above-obtained manifold vector. Because the ambient noise shows a stable directivity, the direct optimization beamformer is deliberately designed to have a specific responese so that it can effectively suppress the ambient noise and improve SNR. The AGs of these different methods are calculated using experimental data and the results show that the direct optimization beamformer provides good SNR enhancement and has more advantages than the DAS and MVDR beamformers.

Reference
1Hawkes MNehorai A1998IEEE Trans. Signal Process.92291
2Cray B AEvora V MNuttall A H2003J. Acoust. Soc. Am.31526
3Schmidlin D J2007J. Acoust. Soc. Am.63569
4Abdi AGuo HSutthiwan P2007OCEANS 2007September 29–October 4, 2007Vancouver, BC1101–10
5Santos PRodríguez OFelisberto PJesus S2010J. Acoust. Soc. Am.52652
6Santos PJoao JRodriguez O CFelisberto PJesus S M2011OCEANS 2011June 6–9, 2011Spain1101–10
7Lindwall D20062006 Society of Exploration Geophysicists (SEG) Annual MeetingNew Orleans, LA120812121208–12
8Wong K TZoltowski M D2000J. Ocean. Eng.2262
9Zou NNehorai A2009IEEE Trans. Signal Process.83041
10Yang DZhu Z2012Sci. China-Phys. Mech. Astron.122338
11Guo XYang S EMiron S 2015 J. Acoust. Soc. Am. 6 3873
12Cray B ANuttall A H1997A comparison of vector-sensing and scalar-sensing linear arrays, 1997, Naval Undersea Warfare Center Division: Newport, Rhode Island.
13D’Spain G LLuby J CWilson G RGramann R A2006J. Acoust. Soc. Am.1171
14Ma Y LYang Y XHe Z YYang K DSun CWang Y M2013IEEE Trans. Ind. Electron.1203
15Wang YYang Y XMa Y LHe Z Y 2014 J. Acoust. Soc. Am. 4 1712
16Wang YYang Y XHe Z YHan Y NMa Y L2015EURASIP J. Adv. Signal Process.681
17Hawkes MNehorai A2001J. Ocean. Eng.3337
18D’Spain GHodgkiss WEdmonds GNickles JFisher FHarriss R1992 OCEANS’92October 26–29,1992Newport, Rhode Island346351346–51
19Wettergren T ATraweek C M2005J. Ocean. Eng.1213
20Yang Y XSun CWan C2003OCEANS 2003September 22–26, 2003San Diego, CA164716531647–53
21Sturm J F1999Optim. Methods Software1–4