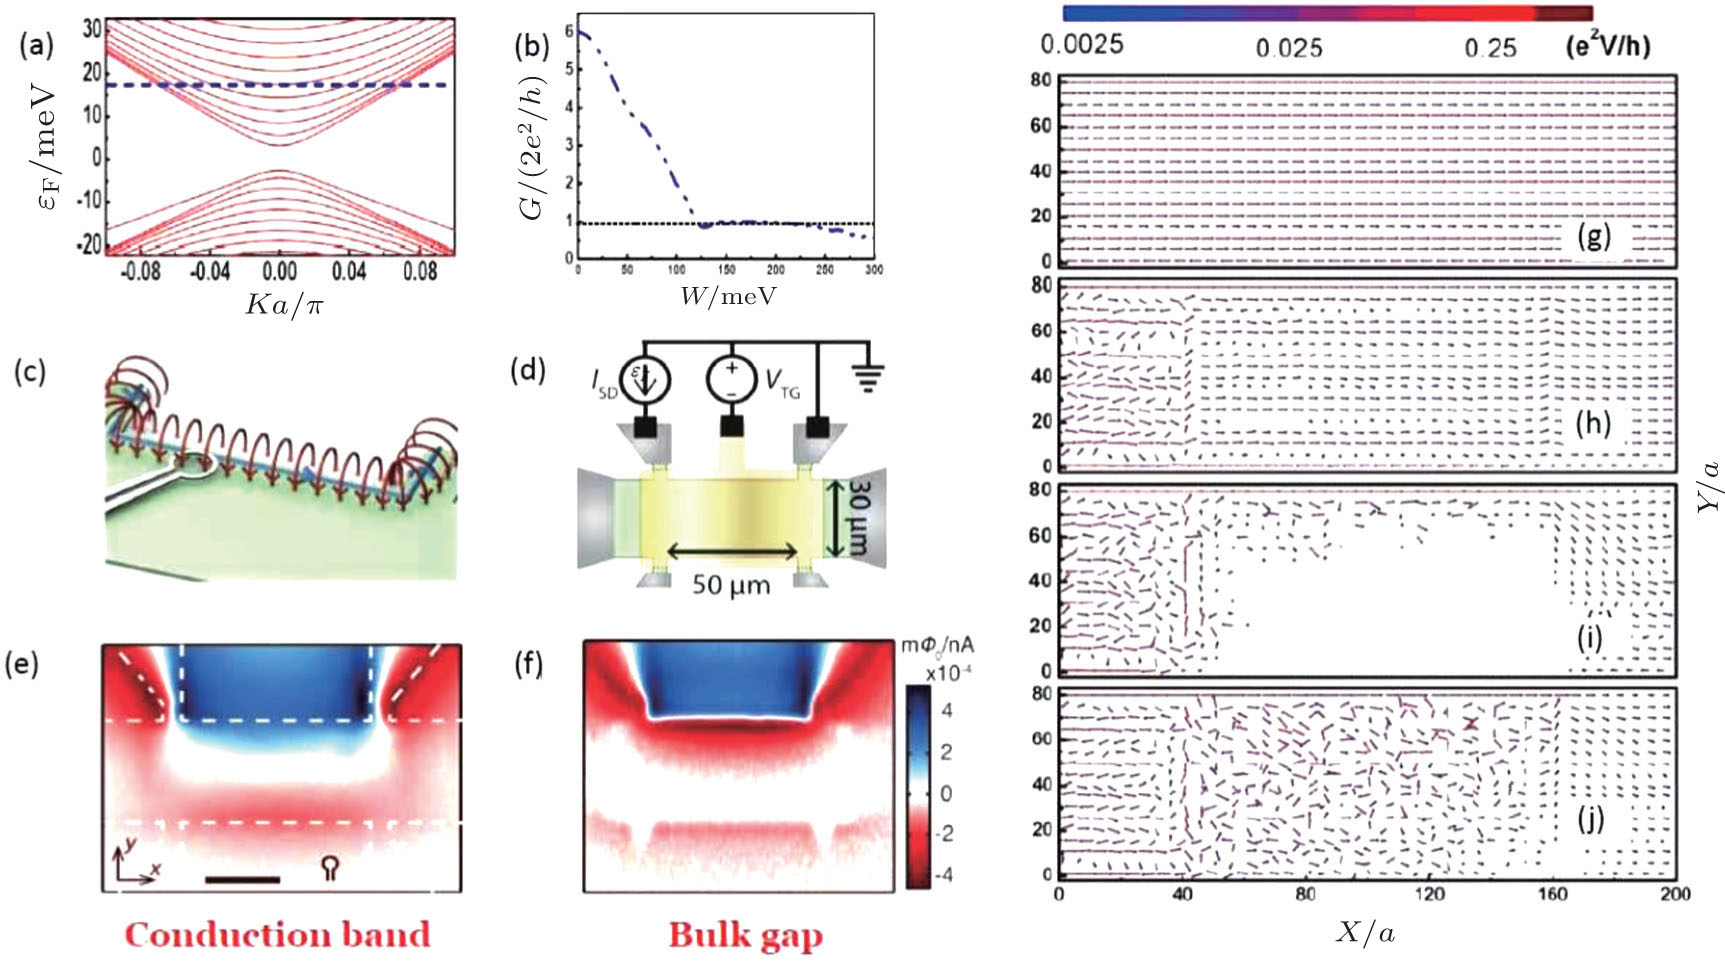
(a) Typical one-dimensional energy spectrum for a normal HgTe/CdTe quantum well strip. (b) Conductance G versus disorder strength W. (g)–(j) Configurations of the local current flow vector for the strip with the same sample sizes as for Fig. 1, and with the disorder strength set at (g) W = 0, (h) W = 100 meV, (i) W = 150 meV, and (j) W = 250 meV. In panels (a), (b), and (g)–(j), the Fermi energy and topological mass are set to be εF = 18 meV and M = 2 meV. (c) Sketch of the configurations for the local current flow measurement. The magnetic field (red) generated by the current (blue) is measured by detecting the flux through the SQUID’s pickup loop. (d) Schematic of a Hall bar. (e) and (f) Typical measured distributions of the local current when Fermi energy is inside the conduction band (e) and the bulk gap (f), respectively. Panels (a), (b), and (g)–(j) are reproduced from Ref. [32]. Panels (c)–(f) are adapted from Ref. [110]. |

