Li Qin-Yi 1, 2, Narasaki Masahiro 2, Takahashi Koji 2, 3, Ikuta Tatsuya 2, 3, Nishiyama Takashi 2, 3, Zhang Xing 1, †,  |
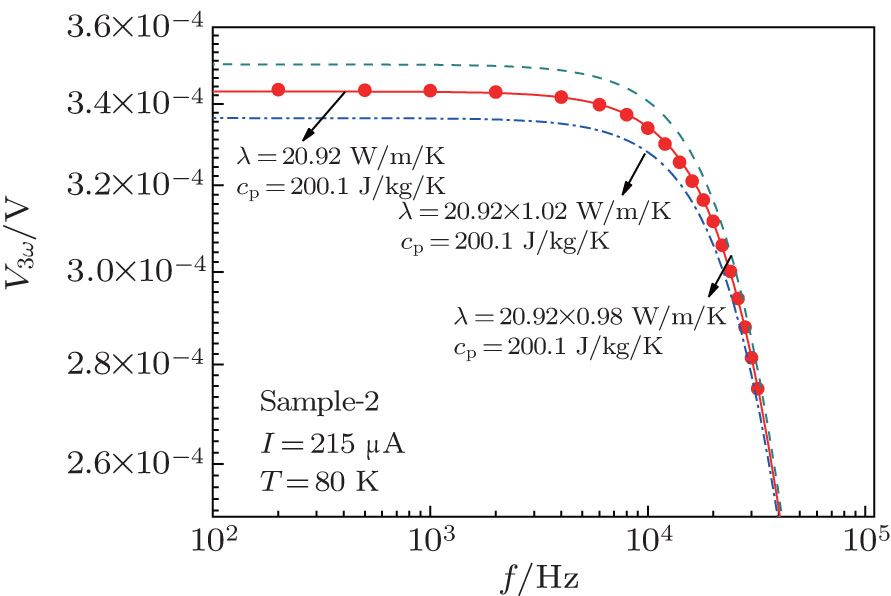
V3ω–f fitting curves at various thermal conductivities for Sample-2 at 80 K. The solid circles show the experimental data; the solid line shows the best fit with 0.01 W/(m·K) and 0.01 J/(kg·K) resolutions, with the fitting results being 20.92 W/(m·K) and 200.1 J/(kg·K); the dashed line shows the V3ω–f curve with a thermal conductivity 2% lower than the fitting result, whereas the dash-dot line shows the V3ω–f curve with a thermal conductivity 2% higher than the fitting result. |

