Tracking molecular structure deformation of nitrobenzene and its torsion–vibration coupling by intense pumping CARS
Wang Chang1, 2, Wu Hong-Lin1, Song Yun-Fei3, He Xing1, Yang Yan-Qiang1, 3, †,  , Tan Duo-Wang3
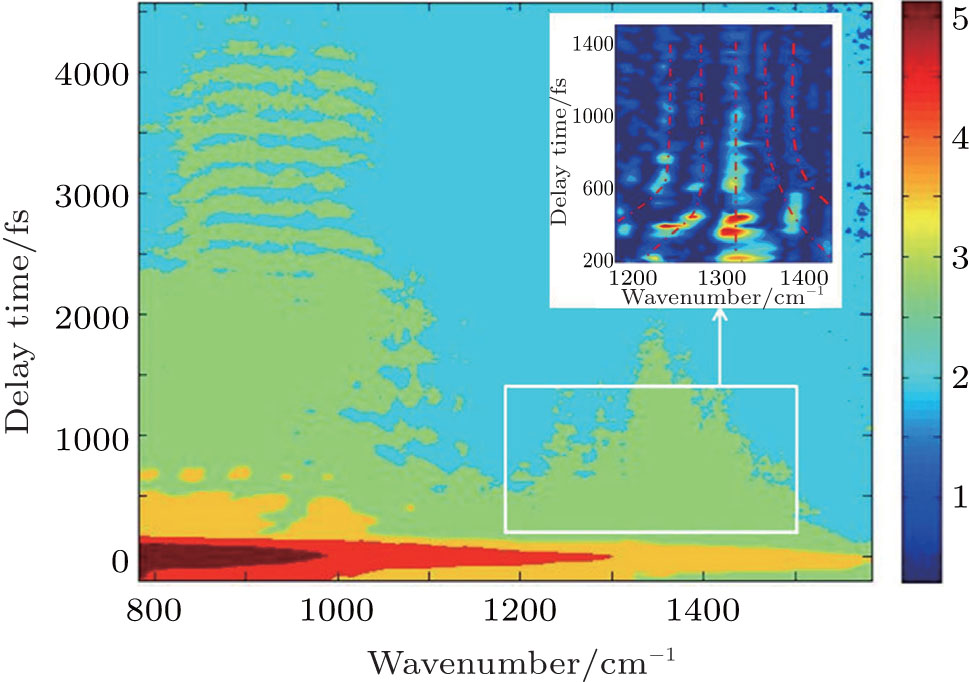
, Tan Duo-Wang3 Logarithmic contour plot of the CARS signal intensity obtained from the sample of liquid NB. The two axes represent delay time and Raman vibrational frequency values, while contours represent the intensity of CARS signal. The inset shows the data in the frequency range of 1200–1500 cm−1 has been processed by subtracting their lower envelope.