Theoretical simulation of 87Rb absorption spectrum in a thermal cell
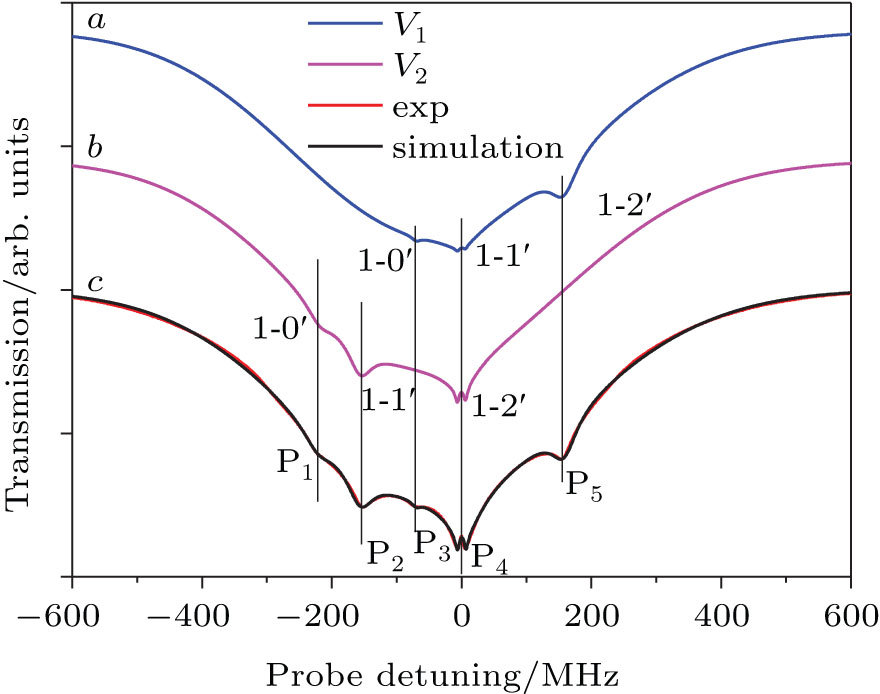
Spectral simulation for the experimental observation. The spectrum can be decomposed into two velocity selective groups

Theoretical simulation of 87Rb absorption spectrum in a thermal cell |
Spectral simulation for the experimental observation. The spectrum can be decomposed into two velocity selective groups |
 |