Theoretical simulation of 87Rb absorption spectrum in a thermal cell
Cheng Hong1, 2, Zhang Shan-Shan1, 2, Xin Pei-Pei1, 2, Cheng Yuan1, 2, Liu Hong-Ping1, 2, †,
       

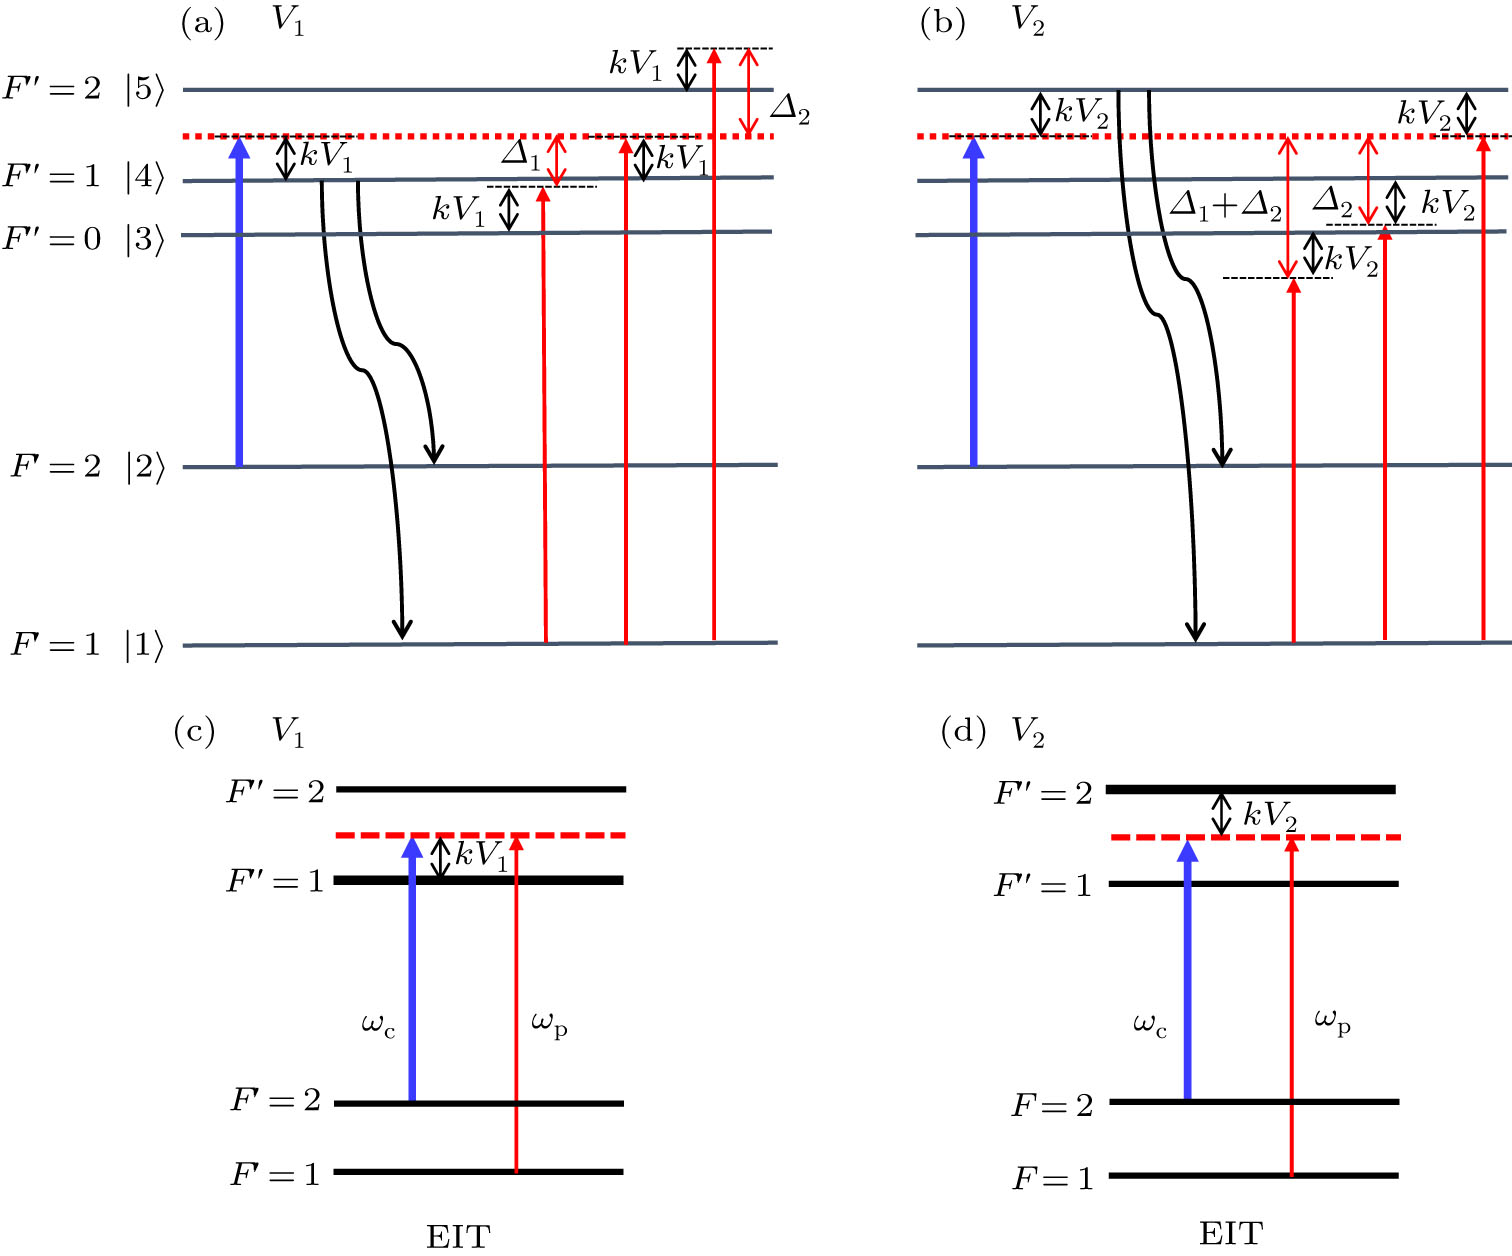
The energy diagram and spectral assignment of the observed spectrum. (a) and (b) Level schemes for the V1 and V2 velocity groups, respectively. The blue solid line indicates the couple beam frequency ωc locked at the F = 2 to F′ =CO1−2 while the weak (red colored) line indicates the probe beam scanning from the ground level F = 1 to the excited level F′ = 0,1,2. (c) and (d) Level schemes showing the formation of the EIT for V1 and V2 velocity groups.