1. IntroductionThe rapid advancement in low-power electrical systems such as sensors in recent decades has led to the great increase of the requirement for the technology of self-power. Harvesting energy from an ambient vibration has attracted considerable interest because it could provide electrical energy for sensors and other micro-electrical devices in a portable and sustainable way.
Among different energy transduction mechanisms, piezoelectric energy harvesters show superior conversion efficiency and can be manufactured in both micro-scale and macro-scale. Initially, studies of the vibration-based energy harvester adopted the linear resonance theory. However, the vibrations existing in most environments are made up of a number of frequencies instead of a single frequency, the linear energy harvester becomes incapable of efficiently harvesting in this environment.[1–3]
To overcome the defect of the narrow bandwidth of linear harvesters, various approaches have been proposed to broaden the bandwidth, e.g., oscillator arrays and active frequency tuning method.[4,5] Another significant improvement in broadening the bandwidth is achieved by introducing nonlinearity, such as mono-stability,[6–9] bi-stability,[10–14] tri-stability,[15–17] and impact,[18] into the design of energy harvesters. Stanton et al.[19] studied the piezoelectric bi-stable harvester and provided the mathematical expression of magnetic repulsion force. Erturk et al.[20] extended the application of the bistable mechanism of Moon[21] to improve the energy harvesting performance and reported that an order of power output over the linear system without magnets. Wang et al.[22] proposed an elastic magnifier to magnify the base vibration displacement to enhance the output characteristic of the bistable oscillator. Zhou et al.[23] investigated the piezomagnetic harvester for enhancing broadband frequency response by altering the angle of two external magnets. Fan et al.[24] improved the performance of piezoelectric energy harvester by using the magnetic coupling of two cantilever beams.
Since the ambient vibration source generally includes many frequency components, even a continuous spectrum in the frequency domain, a few researchers have investigated energy harvesting under stochastic excitation. Litak et al.[25] used numerical methods to investigate the performance of a bistable energy harvester under random excitation and the results showed that the system can attain stochastic resonance. Li et al.[26] undertook numerical and experimental investigations on the stochastic resonance of a tri-stable harvester, and the results demonstrated that it has a better performance compared with the bistable energy harvester under stochastic excitations.
For a bi-stable energy harvester system, broadband excitations may induce its response to take a nearly regular jump between two stable positions (coherence resonance), for which the signal to noise ratio will yield a peak.[27,29] Cao et al.[30] found that the threshold of inter-well oscillation of a bi-stable configuration was dependent on the depth of potential wells. Hosseninloo et al.[31] studied an energy harvester with an adaptive bistable potential, which can be adjusted by an adaptive controller. However, this strategy needs to consider the balance between the energy consumed by the controller and that generated by piezoelectric patches.
This paper presents a new idea to reduce the potential barrier in BEH and elicit the occurrence of snap-through under low-intensity excitation. The rest of this paper is organized as follows. In Section 2, an electromechanical model of the advanced bi-stable energy harvester (ABEH) is established and analytically studied by using the extended Hamilton’s principle. In Section 3, numerical simulations are carried out to analyze the dynamical response under deterministic and stochastic excitations. The results validate that the ABEH can work more efficiently than its conventional bi-stable counterpart. The summary is finally concluded in Section 4.
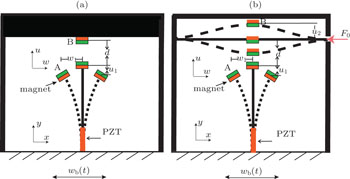
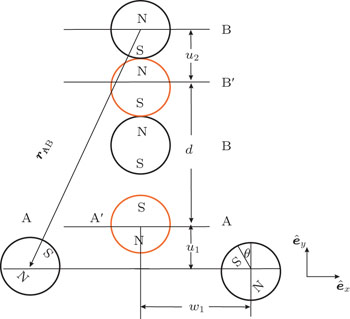
2. Analysis of the modelFigure 1 illustrates the model of traditional bistable energy harvester (BEH) and the proposed advanced bi-stable energy harvester (ABEH) with two movable magnets. As shown in Fig. 1(b), the ABEH includes two elastic beams, a cantilever beam, and a clamped beam. The cantilever beam has a magnet A at the tip, while the clamped beam has a magnet B at the middle. The aim of introducing the clamped beam is to turn the BEH’s fixed magnet into a movable magnet.
In the following analysis, subscripts 1 and 2 refer to the cantilever beam and the clamped beam, respectively, Ek1 and Ek2 denote the kinetic energies of the cantilever beam and the clamped beam, respectively. Then, the total kinetic energy can be given by
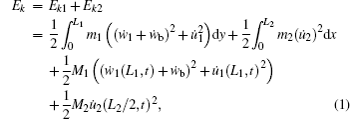
where
L1 and
L2 are the lengths of the piezoelectric beam and the clamped beam, respectively,
w and
u denote the displacements of the beams in
x and
y directions, respectively,
m1 and
m2 are the masses per unit length of the cantilever beam and the clamped beam, respectively, and they can be calculated by

where
δ1,
δ2, and
δp represent the thicknesses of the beams and the piezoelectric layer, respectively;
Lp is the length of the piezoelectric material;
ρ1,
ρ2, and
ρp represent the densities of the beam material and the piezoelectric material respectively;
b represents the widths of the beams and the piezoelectric layer; H(
y) is the Heaviside function to account for the fact that the piezoelectric layer does not cover the entire length of the beam.
M1 and
M2 are the masses of the magnets
A,
B and
wb(
t) represents the base displacement.
Considering the effect of electromechanical coupling, the potential energy of the whole system is
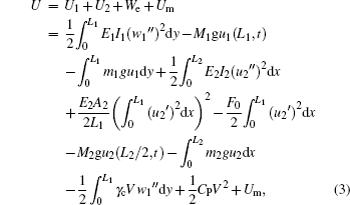
where (·) and (′) indicate the differentiation with respect to time and length coordinate respectively; the flexural rigidity of the piezoelectric beam is represented as
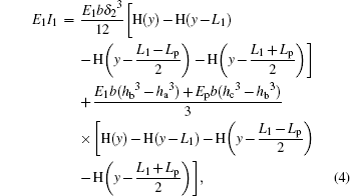
where
E1,
E2, and
Ep denote the Young’s modulus of the metal substrate and the piezoelectric layer, respectively;
ha,
hb, and
hc are the distance from the neutral axis to the bottom surface of the substrate, the distance between the neutral axis and the bottom surface of piezoelectric layer, and that between the neutral axis and the upper surface of the piezoelectric layer, respectively;
[33] the flexural rigidity of the clamped beam is defined as

is the extensional rigidity, where
A2 is the cross-sectional area of the clamped beam;
F0 represents the static axial force; and
γc is the electromechanical coupling term, which can be given by

where
d31 is the piezoelectric coupling coefficient;
CP =
e33bLp/
δp is the capacitance of the piezoelectric material, where
e33 is the permittivity at constant strain;
V(
t) represents the voltage across the piezoelectric layer;
Um refers to the potential energy induced by magnetic forces.
The virtual works done by non-conservative forces are

where
c1 and
c2 are the damping coefficients introduced to approximate the energy loss from the viscous damping;
Q(
t) is the electric charge of piezoelectric layer, and the time rate of change of it is the electric current passing through the resistive load
R, i.e.,
Q̇ =
V/
R.
For the cantilever and clamped beams, their magnets’ masses and positions are likely to induce the first modes of the beams; i.e., for vibrations of the two beams the first modes will be the dominant. Let ψ1 and ψ2 represent the first modes of the cantilever and clamped beams, respectively. Then, the displacement of the cantilever beam at y can be expressed as

and that of the clamped beam at
x can be expressed as

where
p(
t) and
q(
t) denote the generalized temporal coordinates;
ψ1 and
ψ2 are the normalized mode shape functions of the two beams, respectively.
Considering the boundary conditions, ψ1(y) and ψ2(x) should take the following forms:[10,32]

the rotate angle
θ at the free end of the cantilever beam can be approximated by

and the displacement perpendicular to
w1(
t) is

As shown in Fig. 2, in the process of calculating magnetic forces, the permanent magnets in the structure can be considered as point dipoles. In this figure, the red circles denote the unstable equilibrium positions. By their geometrical positions, the vector directed from the middle magnet (B) to the tip magnet (A) is denoted by rBA and can be expressed as

where
êx and
êy denote the unit vectors parallel and perpendicular to
x axis. The magnetic moment vector
μ is dependent on the volume of magnet and is given in Ref. [
14]

where
M represents the vector sum of all microscopic magnetic moments for ferromagnetic material, and
Vm is the material volume. The magnetization vector
M is related to magnet’s residual flux density
Br,
M =
Br/
μ0, where
μ0 = 4
π × 10
− 7 H/m is the magnetic permeability constant.
Based on orthogonal decomposition, the magnetic dipole moment vectors take the following forms:[19]

The magnetic field of dipole B acting on dipole A is given by

where ‖·‖
2 and
∇ denote the
L2-norm and the vector gradient operator respectively.
Thus, the potential energy of magnetic field can be written as

The equivalent magnetic force can be obtained by

From Lagrange equation, the dynamical governing equations of the proposed system can be derived as follows:
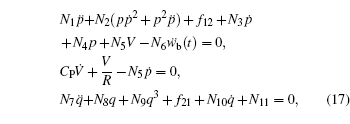
where
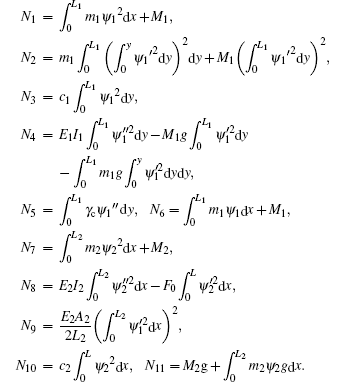
For the BEH’s governing equation, we can derive it by letting u2 = 0; i.e., the clamped beam is considered as a rigid one. Thus the BEH’s governing equation is

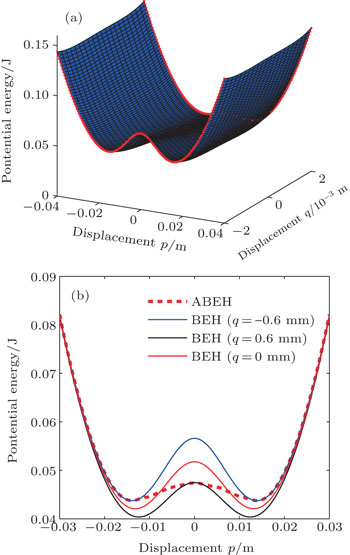
The stability of the system is determined by the position of magnets A and B. Figure 3(a) shows how the shape of mechanical potential energy changes with the displacement of the magnets A and B. The mechanical potential energy is the sum of the elastic potential energy of the beams and the potential energy induced by magnetic forces. From Eqs. (3) and (15), it is known that the energy barrier is determined by the relative interval of the two magnets |rBA|, which is influenced greatly by u1, w1, u2, and d. As magnet A approaches magnet B, the interactive magnetic force will increase gradually such that the clamped beam is eventually forced to jump from the lower equilibrium point (−0.006 m) to the upper equilibrium point (0.006 m), which avoids the occurrence of strong interaction. Thus, the ABEH’s barrier between the potential wells of potential energy will become lower due to the decrease in magnetic interaction (Fig. 3(b)).
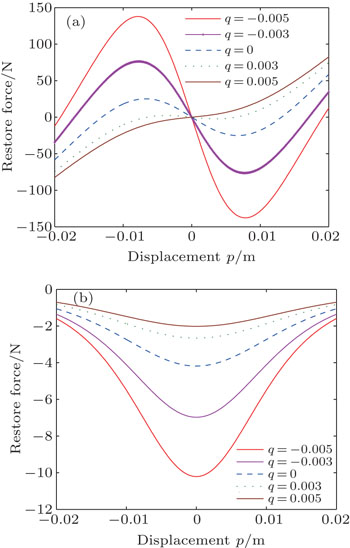
Given that the potential energy is known, the corresponding magnetic forces can be calculated by Eq. (16). Figure 4 shows the corresponding components of the magnetic force in x direction (f12) and y direction (f21). It is apparent that the magnetic force between magnets A and B is weak if the clamped beam moves in the positive direction (q > 0); i.e., it keeps away from the cantilever beam. In contrast, if the clamped beam moves in the negative direction (q < 0), i.e., it approaches the cantilever beam, then the magnetic force will become large. This is consistent with our knowledge regarding the magnetic repulsion force. Next we will focus on the comparison between the performances of the ABEH and BEH.
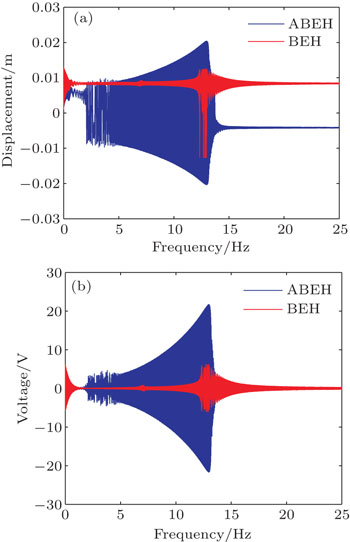
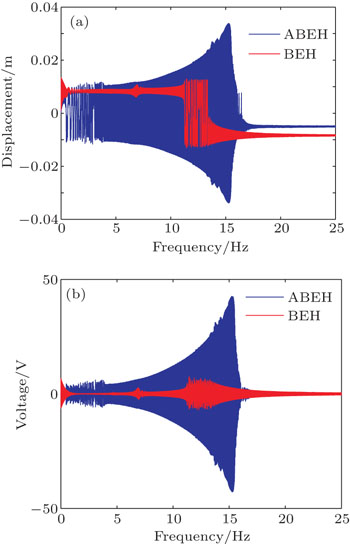
3. Numerical simulation3.1. The case of harmonic excitationIn this part, numerical simulations are carried out to investigate the dynamical response and electrical outputs of the two harvesters under frequency sweeping excitations. The base excitation is set as a harmonic motion governed by  , where a0 is the amplitude and f is the excitation frequency in unit of Hz. The range of the sweeping frequency is set 0–25 Hz, while the amplitudes of base excitations are designated as a0 = 2 m/s2 and a0 = 4 m/s2, respectively. The governing equations (Eqs. (17) and (18)) are solved by numerical method. The system parameters are set as Table 1, while the distance d is designated as 0.02 m. The simulation results are shown in Figs. 5 and 6, where the displacement refers to the tip deflection of the cantilever beam. Comparisons between Figs. 5 and 6 suggest that the proposed energy harvester outperforms the traditional BEH in terms of both voltage amplitude and frequency bandwidth.
Table 1.
Table 1.
 Table 1. Model parameters used for the numerical test. .
| Symbol, description |
Value |
| length of cantilever beam, L1 |
0.2 m |
| length of clamped beam, L2 |
0.15 m |
| length of piezoelectric layer, Lp |
0.02 m |
| width of beams and piezoelectric patch, b |
0.02 m |
| thickness of cantilever beam, δ1 |
0.0008 m |
| thickness of clamped beam, δ2 |
0.0008 m |
| thickness of piezoelectric layer, δp |
0.0008 m |
| Young’s modulus of cantilever beam, E1 |
210 Gpa |
| Young’s modulus of clamped beam, E2 |
69 Gpa |
| Young’s modulus of piezoelectric layer, Ep |
40 Gpa |
| density of cantilever beam, ρ1 |
7800 kg/m3 |
| density of clamped beam, ρ2 |
2700 kg/m3 |
| density of piezoelectric layer, ρp |
7800 kg/m3 |
| static axial force, F0 |
66.6 N |
| damping coefficient, c1 |
0.1 N·s·m−1 |
| damping coefficient, c2 |
0.1 N·s·m−1 |
| coupling coefficient, d31 |
−280 × 10− 12 C·N−1 |
| electrical permittivity, ɛ33 |
3 × 10⁻⁸ F·N−1 |
| magnetization vector, MA,MB |
0.995 × 10⁻⁶ A·m−1 |
| mass of magnet, M1, M2 |
0.012 kg |
| volume of magnet, VA, VB |
π × 0.012 × 0.005 m3 |
| gravity acceleration constant, g |
9.81 m·s−2 |
| Table 1. Model parameters used for the numerical test. . |
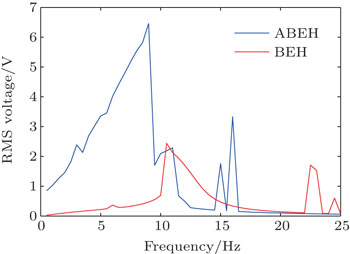
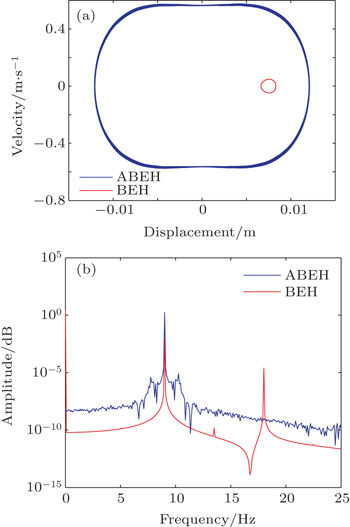
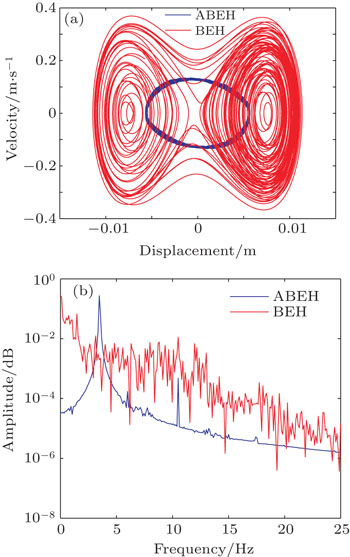
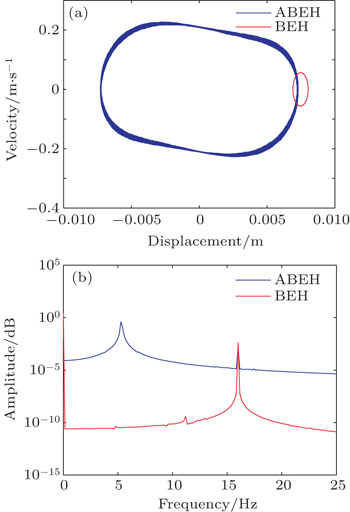
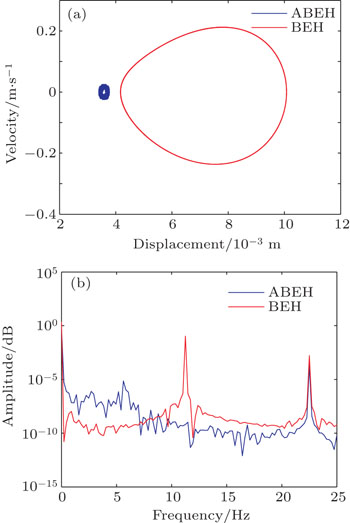
Figure 7 illustrates the variation of steady state RMS output voltage with the exciting frequency at a0 = 2 m/s2, from which we know that for f < 9 Hz the ABEH can generate higher RMS voltages than the BEH; and over the whole range of frequency, there appear some peaks of RMS voltage for both the BEH and ABEH. Specifically for the BEH, the peaks are at f = 10.5 Hz and 22.5 Hz, while for the ABEH, they are at f = 9 Hz and 16.5 Hz. For these frequencies, we calculate their responses respectively and depict the phase portraits and diagrams of the frequency spectrum (Figs. 8–11). First, at f = 9 Hz we can see that now the BEH’s motion is restricted in a potential well, while the ABEH is undergoing an inter-well motion (Fig. 8). Then, at f = 10.5 Hz we find that the BEH enters to a chaotic state and exhibits irregularly jumping between the two equilibrium positions in the phase portrait, along with a large amplitude (Fig. 9(a)); from the corresponding frequency diagram we find that now the ABEH vibrates mainly at 3.5 Hz, 1/3 of the exciting frequency (Fig. 9(b)). Subsequently, at f = 16.5 Hz the ABEH undergoes a large amplitude of inter-well motion, while the BEH returns to an intra-well motion (Fig. 10(a)); it should be noted that now nearly all ABEH’s vibration energy is concentrated at 5.5 Hz (1/3 of exciting frequency), while the BEH still keeps a synchronous response (Fig. 10(b)). Thus, it turns out that the ABEH seems to have the ability to move the exciting energy to a low-frequency response through sub-harmonic vibration and produce a relatively large amplitude. Finally, at f = 22.5 Hz, compared to the ABEH, the BEH has a fairly large amplitude although it is still in an intra-well state (Fig. 11(a)). From the corresponding frequency diagram, we know that now the ABEH’s response is synchronized with the exciting frequency, while the BEH undertakes a sub-harmonic vibration, which results in a large amplitude (Fig. 11(b)).
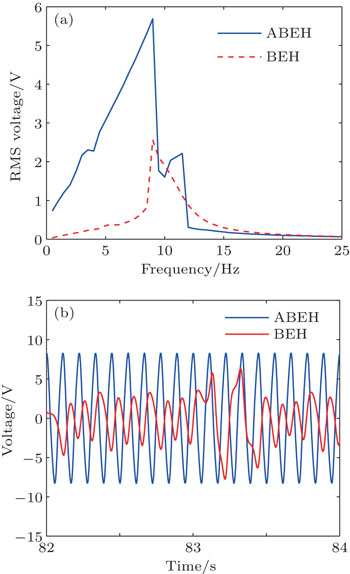
For the ABEH and BEH, we made some adjustments for system parameters to make their peak frequencies to reach identical. Figure 12 shows the resultant voltages at steady states for different frequency excitations, from which we learn that the peaks occur at f = 9 Hz for both systems. But we can see that at this frequency the ABEH’s RMS voltage is considerably larger than that of the BEH (Fig. 12(a)). In terms of waveform (Fig. 12(b)), we know that at this frequency the ABEH has a larger amplitude than the BEH, especially the BEH’s response is a chaotic one rather than a harmonic one. In addition, under the excitation level of a0 = 2 m/s2, the BEH’s high energy range is Δf = 1.5 Hz, while that of the ABEH is Δf = 2.75 Hz. These findings also prove that the ABEH possesses a better harvesting performance.
3.2. The case of random excitationTo study the ABEH’s harvesting ability under random excitations, we set the excitation as Gaussian white noise process  , whose mean and correlation functions are given as follows:

where 〈 〉 denotes the expected value, and
σa is the noise intensity.
The performance of the harvesting device can be evaluated in terms of RMS output voltage and efficiency of power conversion, defined by

where
Pe and
Pm are the effective values of electrical and mechanical powers, respectively.
For an instantaneous power, its effective value is defined as

where
Pins represents the instantaneous power at instant
t. For the ABEH, its instantaneous electrical power harvested is defined as

, where
I is the current,
R the resistance; and its mechanical counterpart is defined as
 [34]
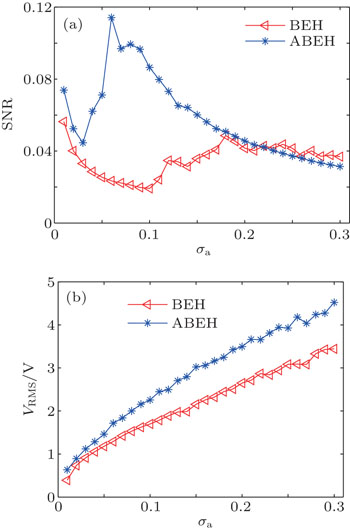
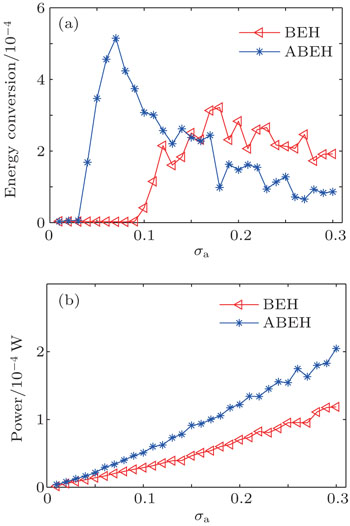
[34]The Euler–Maruyama method[35] and Monte–Carlo method are used in carrying out the stochastic simulation with parameters in Table 1. As the random excitation intensity σa increases, we calculate the corresponding dynamical responses and output voltages of the BEH and ABEH (Figs. 13 and 14). Figure 13 illustrates the signal to noise ratio (SNR = σp/σa,[24] where σp and σa represent the standard deviations of the response and the excitation, respectively) and the RMS voltage. In Fig. 13(a), it should be noted that the pronounced peak implies the occurrence of coherence resonance, in which the system can keep nearly regular jumps between the potential wells. The peak for the ABEH appears at σa = 0.06, while that for the BEH at σa = 0.18. This indicates that the ABEH can reach coherence resonance at a weaker excitation. Then, from Fig. 13(b), we know that the ABEH can generate a higher output voltage over the whole range of σa. Figure 14 illustrates the efficiency of energy conversion and the output power versus σa. This indicates that the ABEH is better than the BEH in the view of output power.
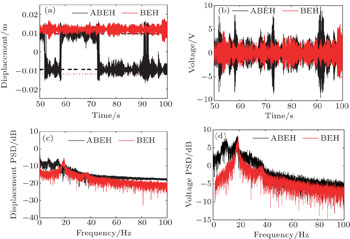
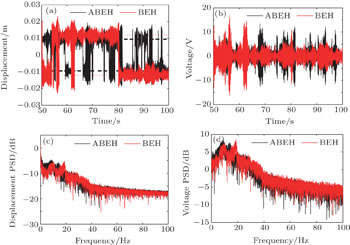
Figures 15 and 16 show the time histories of the cantilever beam’s tip displacements, the output voltages simultaneously generated by the piezoelectric material, the spectrum of displacement and the spectrum of voltage at σa = 0.07 and σa = 0.3, respectively. From the results, it can be seen that at σa = 0.07 the BEH’s response is restricted in a single potential well, whereas jumping between the potential wells starts to occur in the ABEH (Fig. 15); and the highest output voltage of the ABEH can attain Vmax = 9.2 V, while that of the BEH is only Vmax = 6.1 V. As for the spectrum, figures 15(c) and 15(d) show PSDs of the displacement and voltage for ABEH and BEH. They prove the advantage of the ABEH. Then, as σa increases to 0.3, the BEH and ABEH both undergo jumping between potential wells. The BEH has a high potential barrier, which hinders frequently jumping between the potential wells. However, for the ABEH, its barrier is relatively low, which makes frequently jumping between the potential wells easy to occur, and thus it can give the higher output voltage. This can be clearly seen from the RMS output voltages for the two harvesters ( for the ABEH and
  for the BEH) (Fig. 13(b)). From the PSDs of the displacement and voltage (Figs. 16(c) and 16(d)), we can conclude that the ABEH can make an efficient electromechanical energy conversion under stochastic excitation.


