Asymmetric and symmetric meta-correlations in financial markets
Li Xiaohui, Shen Xiangying, Huang Jiping†, 
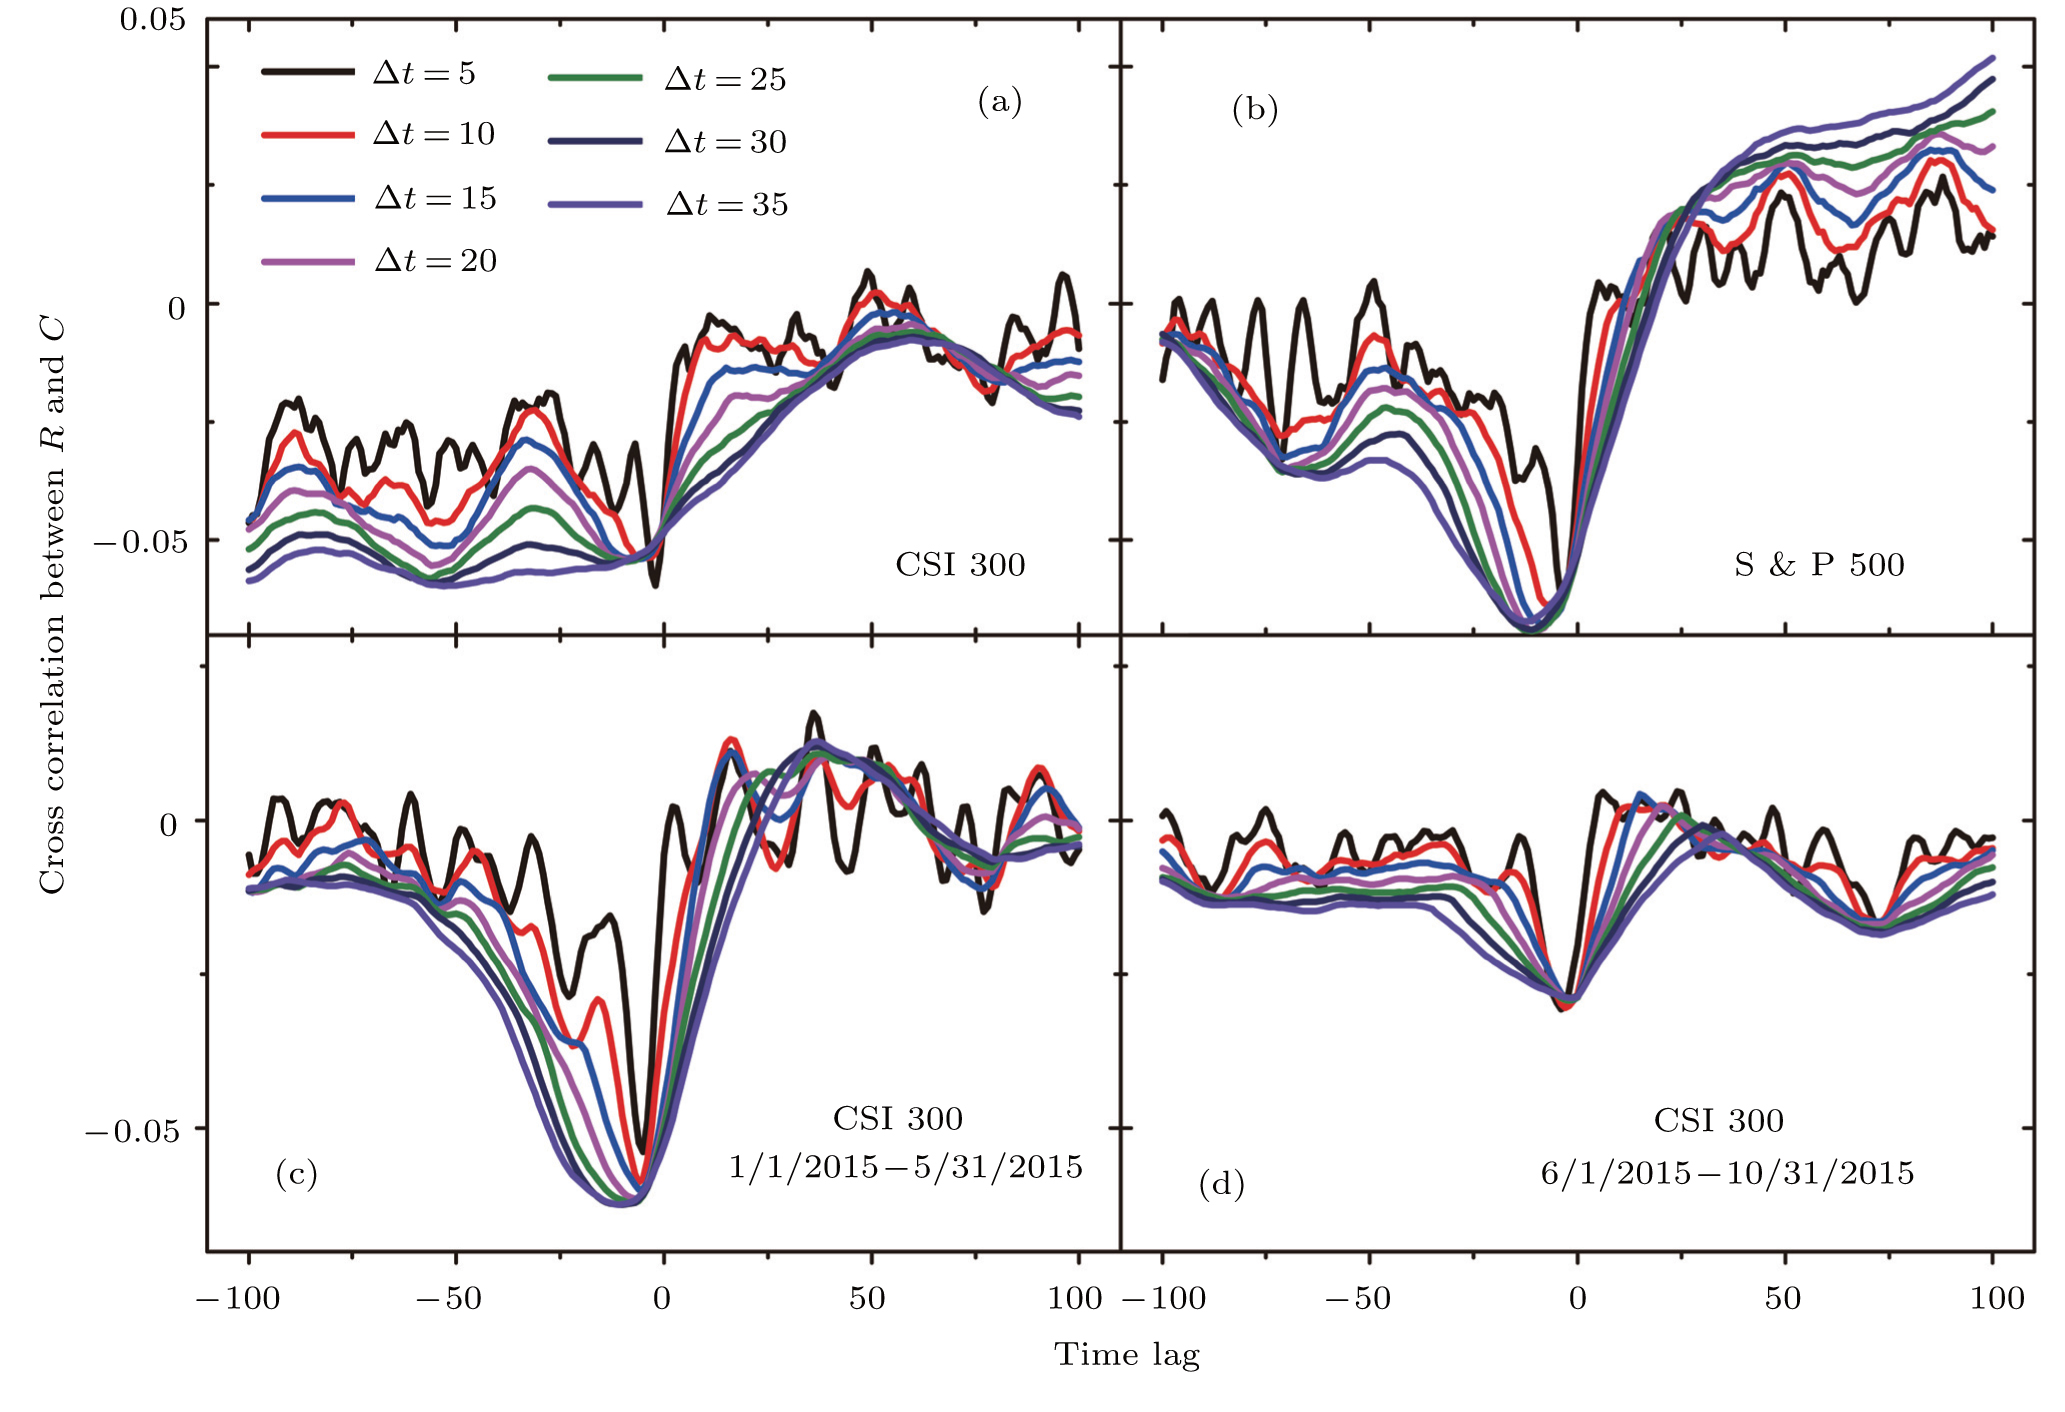
Panels (a) and (b) show the cross-correlations between the normalized index return
Asymmetric and symmetric meta-correlations in financial markets |
|
Li Xiaohui, Shen Xiangying, Huang Jiping†,
|
Panels (a) and (b) show the cross-correlations between the normalized index return |
| |