Asymmetric and symmetric meta-correlations in financial markets
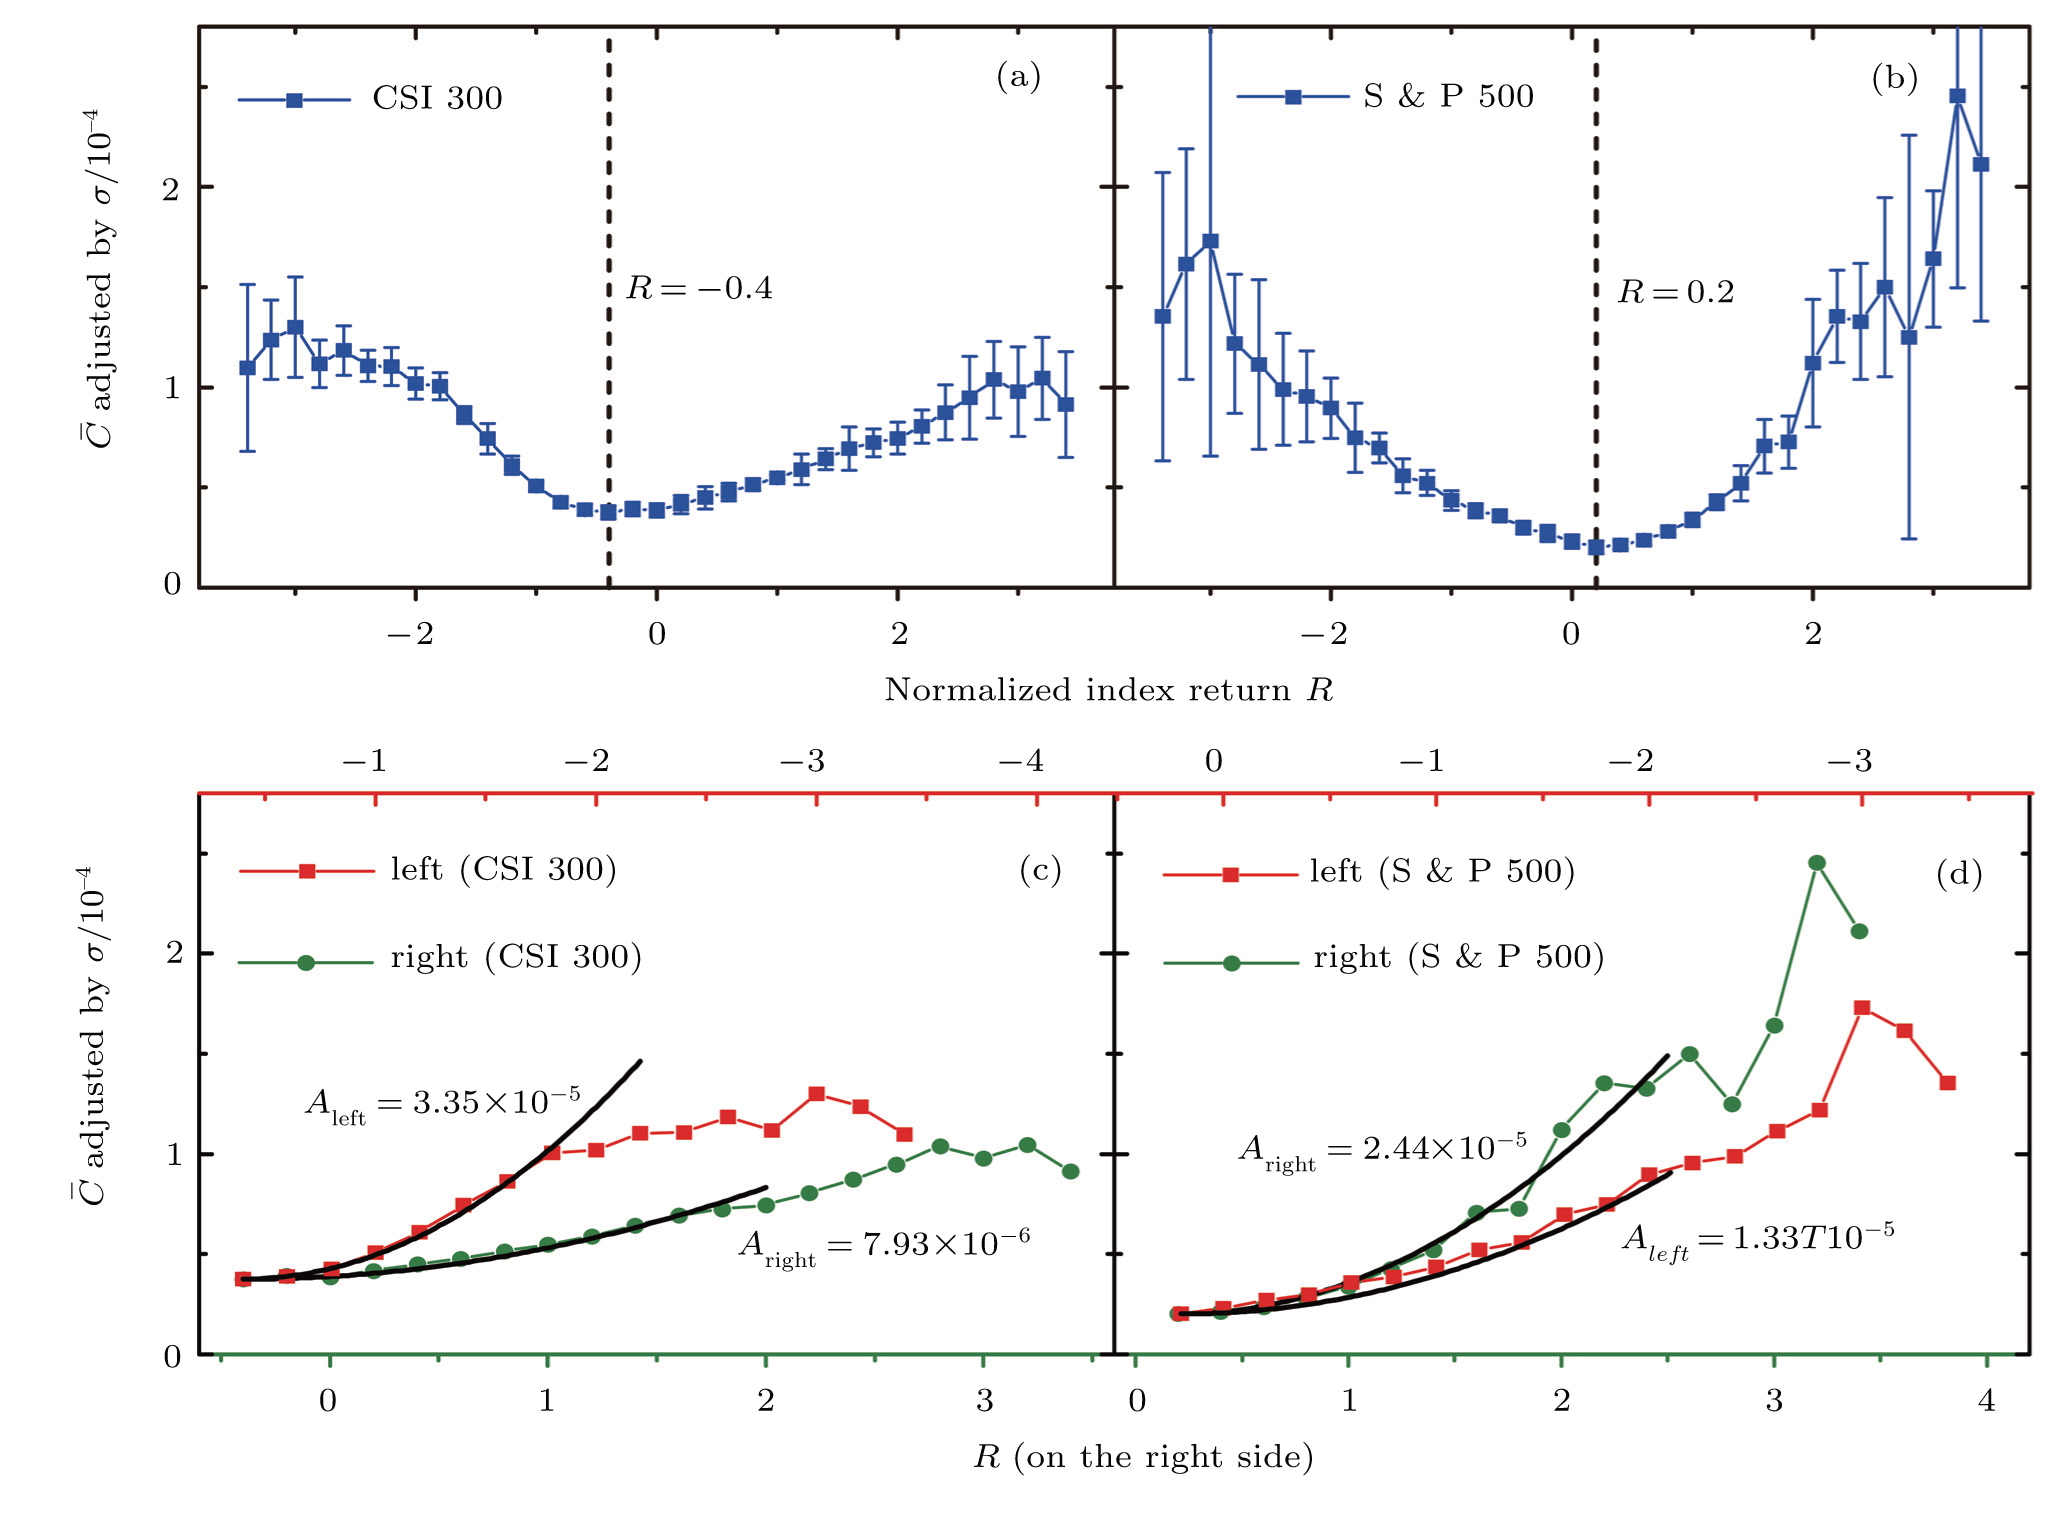
Panels (a) and (b) show the mean meta-correlation result separately with different Δ

Asymmetric and symmetric meta-correlations in financial markets |
Panels (a) and (b) show the mean meta-correlation result separately with different Δ |
 |