Asymmetric and symmetric meta-correlations in financial markets
Li Xiaohui, Shen Xiangying, Huang Jiping†, 
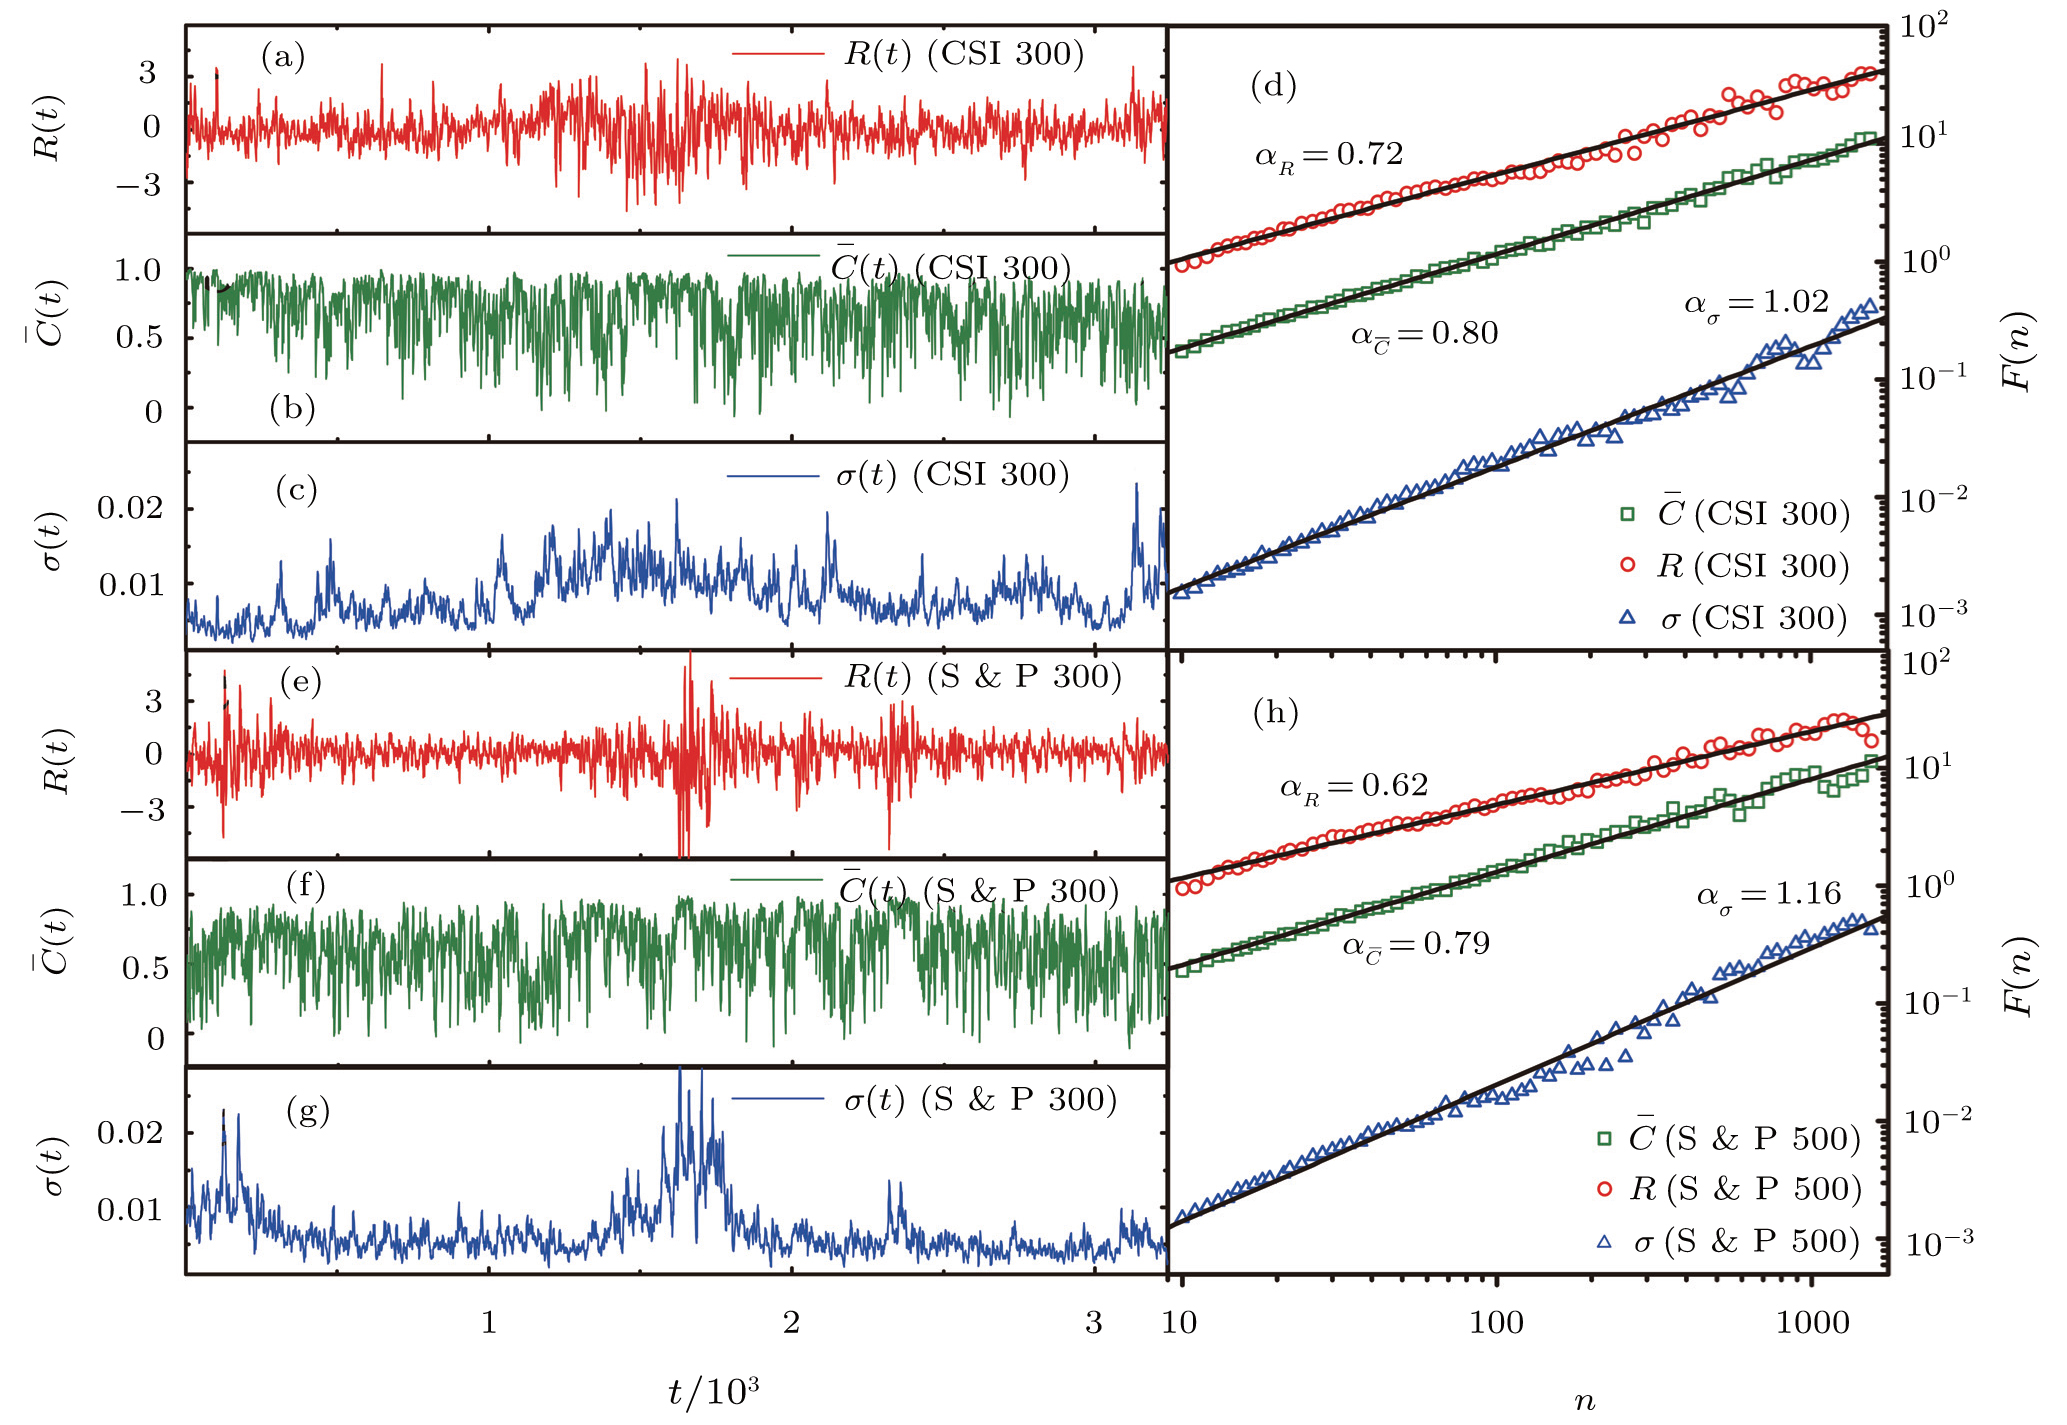
Three time series for CSI 300, normalized index return
Asymmetric and symmetric meta-correlations in financial markets |
|
Li Xiaohui, Shen Xiangying, Huang Jiping†,
|
Three time series for CSI 300, normalized index return |
| |