Asymmetric and symmetric meta-correlations in financial markets
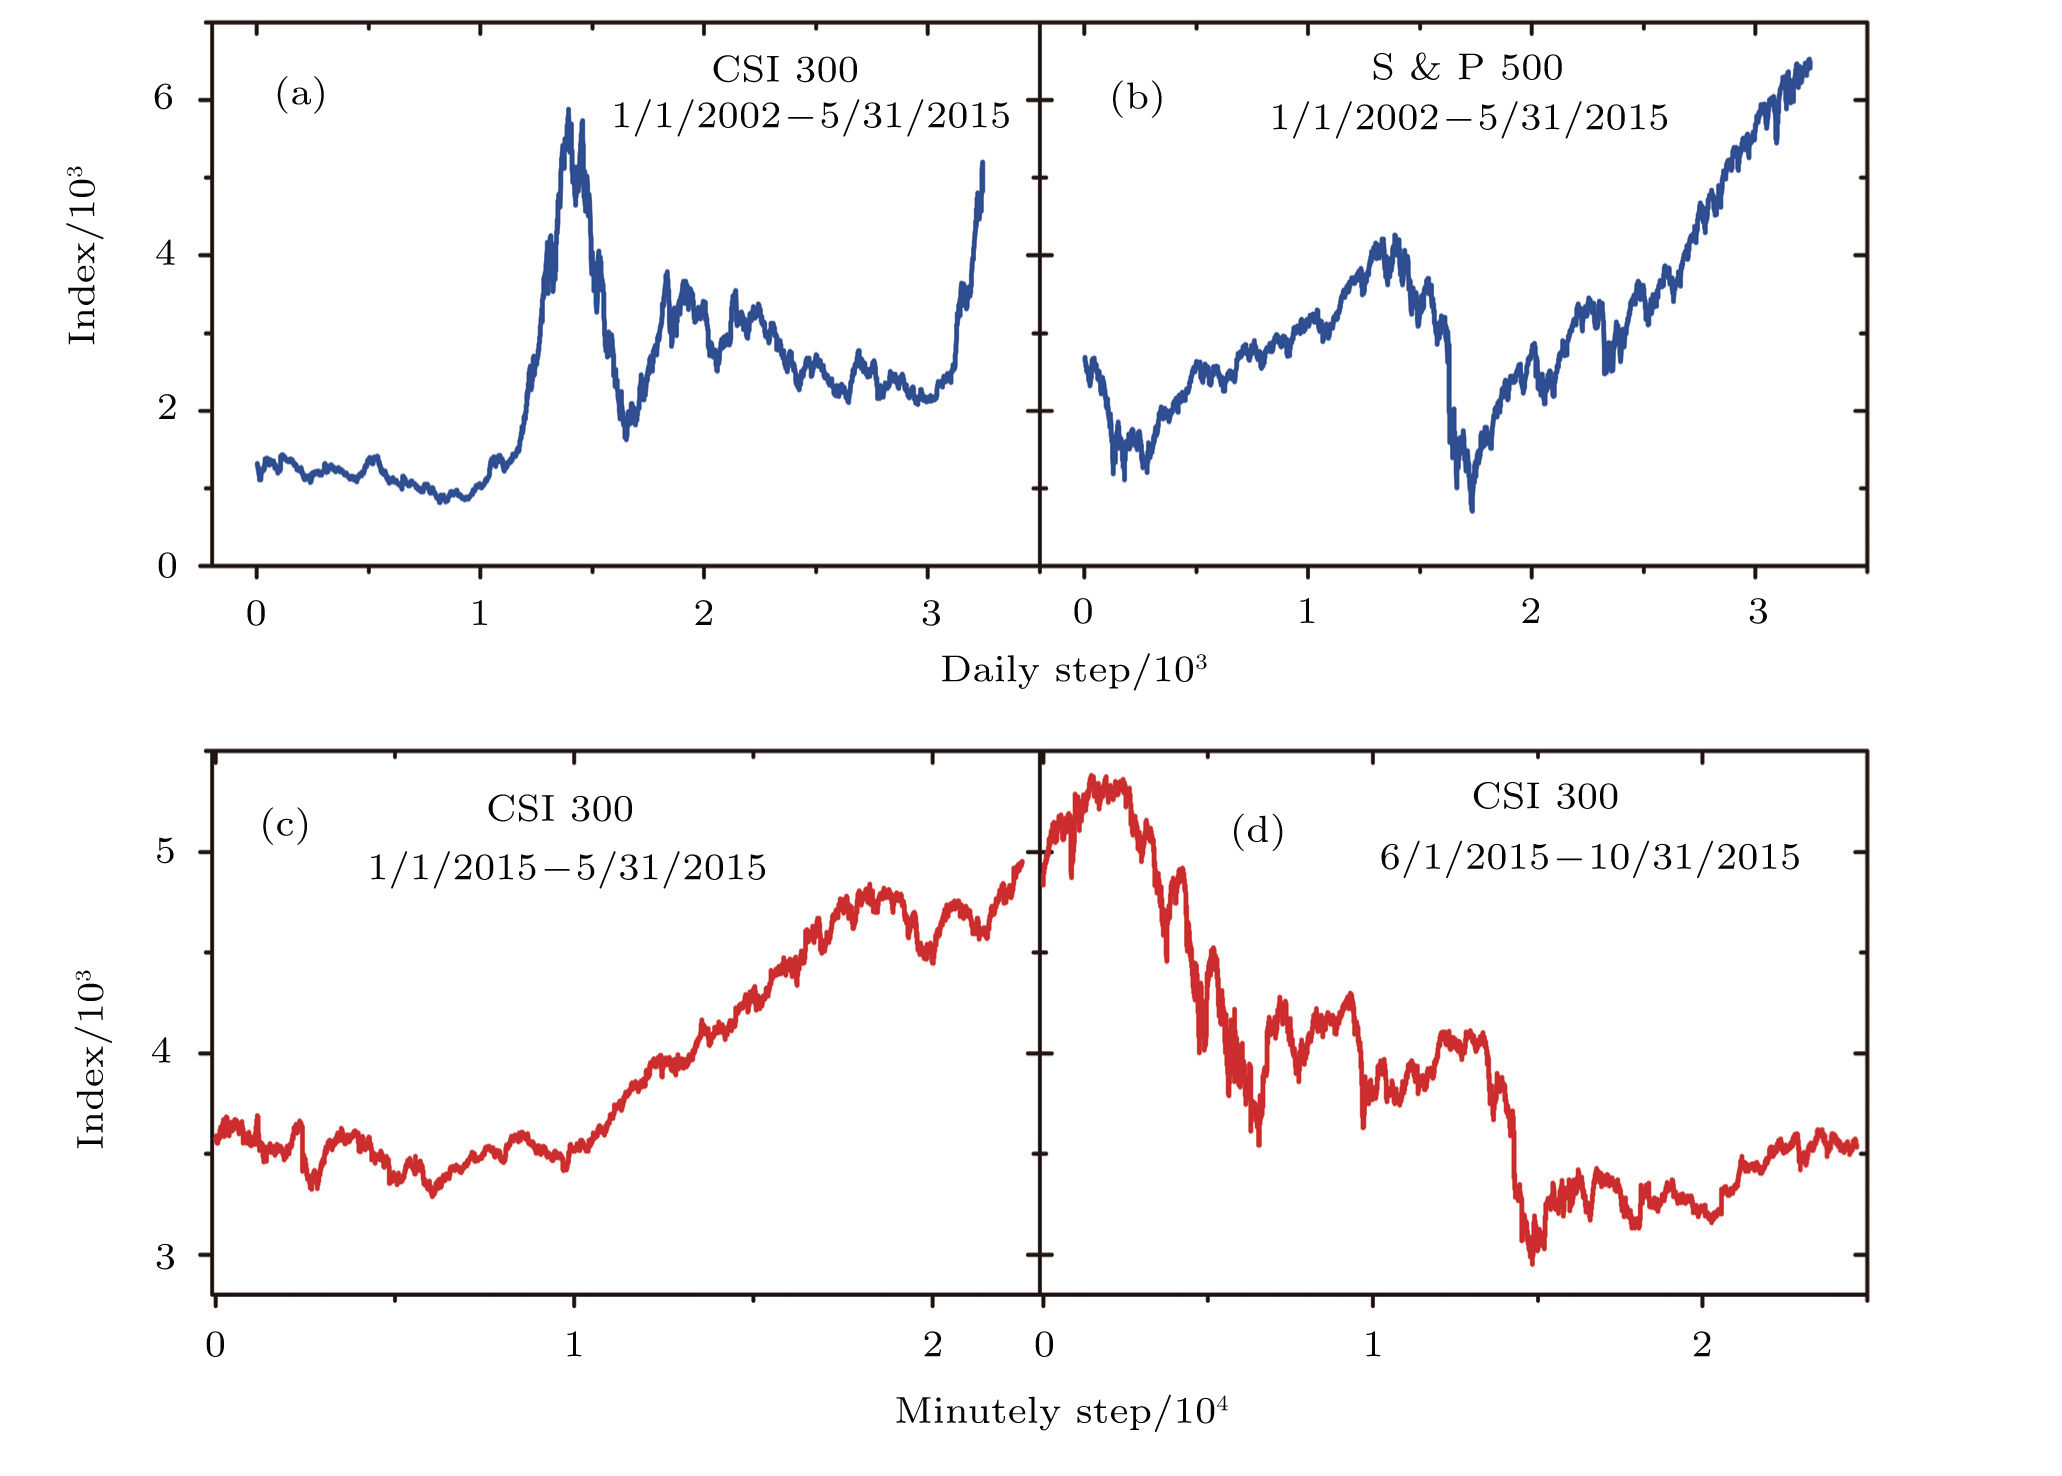
Panels (a) and (b) show the daily behaviors of the market index from 1/1/2002 to 5/31/2015 in CSI 300 and S & P 500 respectively. The minute index behaviors in a upward trend in CSI 300 from 1/1/2015 to 5/31/2015 are shown in panel (c), whereas index behaviors in a downward trend from 6/1/2015 to 10/31/2015 are shown in panel (d).

