† Corresponding author. E-mail:
Project supported by the University of Guilan and the Iran Nanotechnology Initiative Council.
The structural and magnetic properties of the synthesized pure and functionalized CoFe2O4 magnetic nanoparticles (NPs) are studied by analyzing the results from the x-ray diffraction (XRD), transmission electron microscopy (TEM), FT–IR spectroscopy, thermogravimetry (TG), and vibrating sample magnetometer (VSM). To extract the structure and lattice parameters from the XRD analysis results, we first apply the pseudo-Voigt model function to the experimental data obtained from XRD analysis and then the Rietveld algorithm is used in order to optimize the model function to estimate the true intensity values. Our simulated intensities are in good agreement with the experimental peaks, therefore, all structural parameters such as crystallite size and lattice constant are achieved through this simulation. Magnetic analysis reveals that the synthesized functionalized NPs have a saturation magnetization almost equal to that of pure nanoparticles (PNPs). It is also found that the presence of the turmeric causes a small reduction in coercivity of the functionalized NPs in comparison with PNP. Our TGA and FTIR results show that the turmeric is bonded very well to the surface of the NPs. So it can be inferred that a nancomposite (NC) powder of turmeric and nanoparticles is produced. As an application, the anti-arsenic characteristic of turmeric makes the synthesized functionalized NPs or NC powder a good candidate for arsenic removal from polluted industrial waste water.
Magnetic nanoparticles (NPs) have attracted considerable attention, due to their special properties and applications in different fields like data storage, biomedicine, photo catalyst, and waste water treatment.[1–9] Also, surface modification of NPs with green and biocompatible material, which is used in the aforementioned applications, is an interesting approach considered in recent years.[10–14] Biocompatibility, chemical stability, and prevention of the agglomeration are the most significant features that can be achieved via surface functionalization.[15–18] Such a surface modification of magnetic NPs also prevents surface oxidation and changes of magnetic properties like magnetization and coercivity.[19] Different organic molecules like polymers,[20,21], liposomes,[22] dendrimers,[23,24] monomeric stabilizers,[25] and inorganic materials[26] have been used as a shell of magnetic NPs. Turmeric is a green, non-toxic, biocompatible, and eco-friendly material and its anti-arsenic characteristic makes it a good candidate for removal of arsenic from polluted industrial waste water. In this work we use turmeric for coating the cobalt ferrite (CoFe2O4) NPs. CoFe2O4 has an inverse spinel structure (AB2O4) and unique properties such as large inherent coercivity (5400 Oe, 1 Oe = 79.5775 A/m), temperate saturation magnetization of about 80 emu/g, striking chemical stability and mechanical strength which make it an appropriate candidate for absorbing heavy metals from industrial waste water.[27–31] In this work, using the chemical co–precipitation method, we synthesize turmeric-stabilized CoFe2O4 NPs and optimize their surface to achieve a larger surface area and larger magnetization. The synthesized NC powder is characterized by x-ray diffraction (XRD), VSM, TG, FTIR, and transmission electron microscopy (TEM) analyses. The rest of this article is organized as follows: In Section 2, we introduce our experimental method of synthesizing the NC powder. In Section 3, the results are presented and discussed. Our conclusions are provided in Section 4.
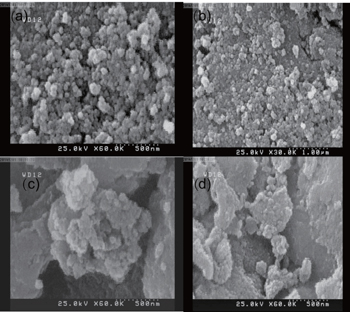
CoFe2O4magnetic NPs are prepared by chemical co-precipitation of Fe·Cl3·6H2O and CoCl2·4H2O by using NaOH solution as a precipitant under boiling condition and stirring for about 1 h (sample S1). In the following step, turmeric is added into the solution and stirred for 30 min (sample S2) and 1 h (sample S3), respectively. At this stage, turmeric-functionalized cobalt ferrite NPs are formed in the solutions. Then they are dried in an oven: sample S1 is dried for 18 h and samples S2 and S3 are both dried for 40 h. Our products have been shown in Fig.
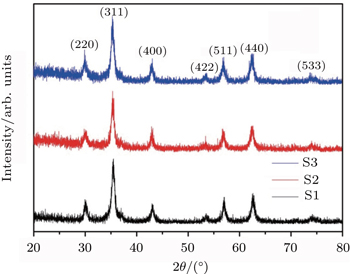
The XRD analysis is used for structural characterization and diffracted patterns are achieved via an x-ray diffractometer (Philips, X’Pert) using Cu Kα radiation (λ = 0.15418 nm). The scan conditions are as follows: the step size is 0.01°; measurement time is 1 s and measurement temperature is 25 °C. The diffracted patterns of the synthesized samples are shown in Fig.
 | Fig. 2. The x-ray diffraction patterns of the samples. All peaks can be indexed to the spinel CoFe2O4 with no evidence for secondary phase formation. |
As can be seen in Fig.

Estimation of the initial crystallite size as an input for refinement process is obtained using Scherrer formula[32] which is defined as follows:

 | Fig. 3. Rietveld refinements of the x-ray powder diffraction pattern for samples: (a) S1, (b) S2, and (c) S3. |
The average crystallite size of the samples is determined from the (311) peak using the Rietveld refinement. As summarized in Table
| Table 1. Summary of the structural data; magnetic characteristics and synthesis condition of the samples. Total stirring time is given by T (in unit h); and the stirring time of turmeric with the CoFe2O4 NPs is denoted by t (in unit h). The parameter D (in unit nm) describes the average crystallite size of the samples. Ms (in units emu/g) and Hc (in unit Oe) are the saturation mass magnetization (at the given field) and coercive field, respectively. The Lattice constant of the samples is depicted by α (in unit nm). . |
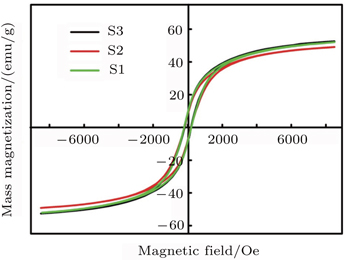
Magnetic properties of the synthesized NC powder are estimated via VSM analysis (VSM, Meghnatis Daghigh Kavir Co., Iran) with applied field up to 10 kOe at room temperature. The hysteresis loops of samples are depicted in Fig.
On a nanoscale, the surface component of anisotropy plays a considerable role in magnetic anisotropy of the NPs. Since the decrement of the particle size enhances the surface anisotropy contribution, magnetic anisotropy increases in NPs.
Unlike metal cations in the volume of NPs, those that are at the surface extremely lose their coordination symmetry due to the loss of some oxygen atoms. By using turmeric for the surface functionalization of the NP, the missing oxygen atom positions can be occupied by turmeric molecules. Under a given coordination symmetry (octahedral, tetrahedral, and etc.), the crystal field splitting energy (CFSE) that originates from the splitting of the d orbits will be determined by ligand coordination and its strength. Spin–orbit coupling at magnetic cations leads to a magnetic anisotropy which decreases with the decreasing of the spin–field coupling.
Functionalization with turmeric makes the surface atoms coordinated with turmeric and enhances the CFSE. Since CFSE is inversely proportional to the spin–orbit coupling, the surface anisotropy decreases and leads to the decrease in coercivity of the NPs. As summarized in Table
The FTIR spectra of pure turmeric and the synthesized turmeric coated cobalt ferrite NPs are shown in Fig.
In the spectra, the peaks around 3474, 2927, and 1631 cm−1 are related to OH, C–H, and C=C groups, respectively, which are in agreement with the results of Sahu et al.[33] Bands at 1437 cm−1 and 1323 cm−1 are related to the longitudinal vibration of C–O in turmeric.[34] The FTIR spectra of all the as-synthesized samples show two characteristic absorption bands in a range of 400 cm−1–600 cm−1, which is a usual feature of all spinel ferrites. The band at around 584 cm−1 is related to the metal–oxygen stretching vibration in a tetrahedral complex and the band at around 420 cm−1 is related to the metal–oxygen stretching vibration in an octahedral complex.[34] As can be seen, most of the bands that appear in the spectrum of pure turmeric are also present in the spectrum of turmeric coated NPs similarly or with a small shift proving that the turmeric is coated on the surface of NPs successfully. The induced shift in the vibration frequency of the band can be attributed to the conjunction of turmeric to the surface of NPs.
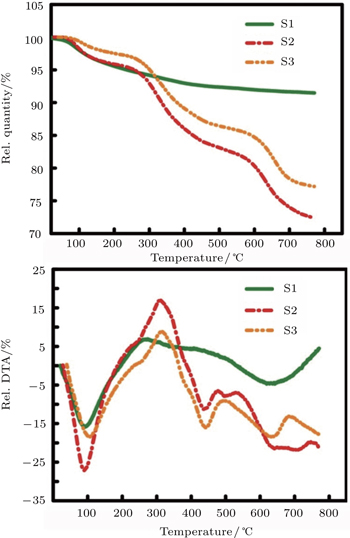
Thermo gravimetry analysis (TGA) and differential thermal analysis (DTA) give a measurable proof to the structure of the coated NPs. TGA gives an estimation of the bonding strength of the bonded ligand to the surface of the NPs[36,37] and the DTA determines whether the process is endothermic or exothermic. For this purpose, magnetic NPs are heated from 30 °C to 800 °C under air atmosphere (Fig.
For different samples, one observes a first weight loss of 3%–4% associated with an endothermic peak at about 95 °C–105 °C due to the loss of water. For pure cobalt ferrite nanoparticles (sample S1) the mentioned peak is observed at 95 °C. Between 200 °C and 330 °C the decarbonation occurs which is associated with a high exothermic peak with a weight loss of about 2%–3%.[38,39] The peak is due to the combustion of organic residuals coming from the precursor or the solvent.
In samples S2 and S3 that contain turmeric in their structures, the weight loss processes are observed in four stages. The loss of water reduces the weights of samples about 4% and 3% for S2 and S3, respectively. The exothermic decarbonation step shifts towards higher temperature (about 300 °C–340 °C) and intensities in these cases.
The mentioned process is accompanied by a weight loss of about 8% for S2 and 7% for S3. The third step contains 6% and 5% weight loss at about 430 °C–440 °C in samples S2 and S3, respectively. The peaks have endothermic characteristics and are related to the bond cleavages of turmeric ingredients (especially curcumin and dimethoxycurcumin) in turmeric-functionalized samples. Finally, at about 620 °C–700 °C, both of the turmeric-functionalized samples (S2 and S3) show another endothermic peak with about 10% weight loss corresponding to the bond cleavage and decomposition of resins included in their turmeric structure.
Figure
Cobalt ferrite NPs are prepared by chemical co-precipitation and functionalized for the first time with turmeric as a green, non-toxic and eco-friendly material. By tuning the stirring times of the suspension of turmeric and the synthesized cobalt ferrite NPs, we achieve the NC powder with a saturation magnetization almost equal to that of the unfunctionalized cobalt ferrite NPs. The presence of the shell causes a small reduction in coercivity of the synthesized NC powder. The hysteresis loop is observed in the VSM analyses of all samples. For estimating the crystallite size of NPs, we first use Rietveld analysis to fit a model to the XRD data and simulate the intensity values and then extract all structural parameters from the simulated intensities. Our TGA and FTIR results show that the turmeric is bonded very well to the surfaces of the nanoparticles. So it can be concluded that a nanocomposite powder of turmeric and nanoparticles are made, which has a green material as the base. As an application the synthesized NC powder is a good candidate for industrial waste water treatment by using the anti-arsenic characteristic of turmeric.
| 1 | |
| 2 | |
| 3 | |
| 4 | |
| 5 | |
| 6 | |
| 7 | |
| 8 | |
| 9 | |
| 10 | |
| 11 | |
| 12 | |
| 13 | |
| 14 | |
| 15 | |
| 16 | |
| 17 | |
| 18 | |
| 19 | |
| 20 | |
| 21 | |
| 22 | |
| 23 | |
| 24 | |
| 25 | |
| 26 | |
| 27 | |
| 28 | |
| 29 | |
| 30 | |
| 31 | |
| 32 | |
| 33 | |
| 34 | |
| 35 | |
| 36 | |
| 37 | |
| 38 | |
| 39 |


