Optical absorption enhancement in slanted silicon nanocone hole arrays for solar photovoltaics
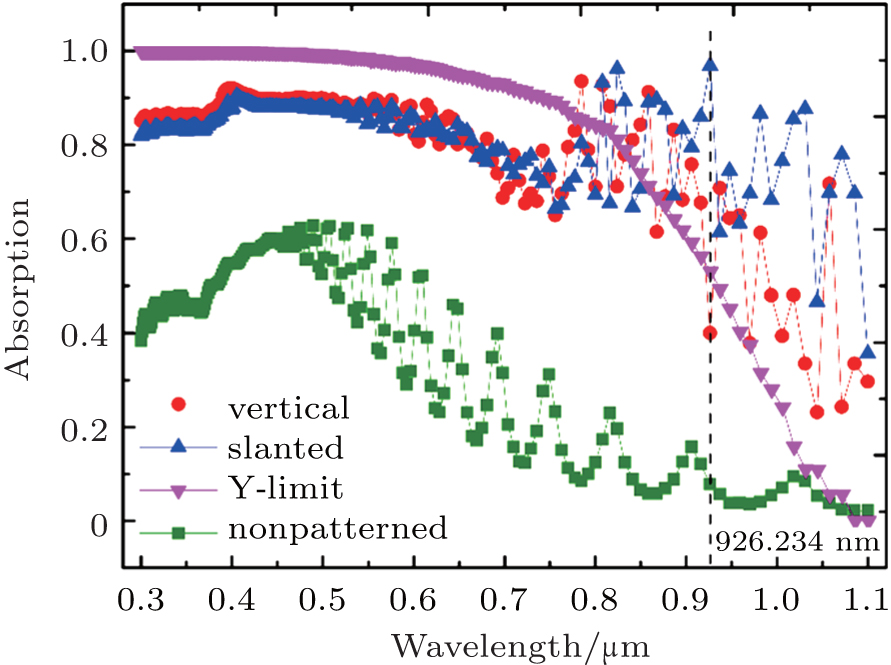
Absorption spectra under normal incidence from AM1.5 solar irradiance. The olive square curve represents the absorption spectrum of the nonpatterned solar cell, the pink triangle curve denotes the Yablonovitch limit (labeled as the Y-limit), while the red circle curve and the blue triangle curve refer to the absorption spectra for the “vertical” cell and the “slanted” cell, respectively.

