


Analysis of the blackbody-radiation shift in an ytterbium optical lattice clock
[Xu Yi-Lin, Xu Xin-Ye†,  ]
]
]
|
|


† Corresponding author. E-mail:
Project supported by the National Key Basic Research and Development Program of China (Grant No. 2012CB821302), the National Natural Science Foundation of China (Grant No. 11134003), the National High Technology Research and Development Program of China (Grant No. 2014AA123401), and the Shanghai Excellent Academic Leaders Program of China (Grant No. 12XD1402400).
We accurately evaluate the blackbody-radiation shift in a 171Yb optical lattice clock by utilizing temperature measurement and numerical simulation. In this work. three main radiation sources are considered for the blackbody-radiation shift, including the heated atomic oven, the warm vacuum chamber, and the room-temperature vacuum windows. The temperatures on the outer surface of the vacuum chamber are measured during the clock operation period by utilizing seven calibrated temperature sensors. Then we infer the temperature distribution inside the vacuum chamber by numerical simulation according to the measured temperatures. Furthermore, we simulate the temperature variation around the cold atoms while the environmental temperature is fluctuating. Finally, we obtain that the total blackbody-radiation shift is -1.289(7) Hz with an uncertainty of 1.25 × 10⁻¹⁷ for our 171Yb optical lattice clock. The presented method is quite suitable for accurately evaluating the blackbody-radiation shift of the optical lattice clock in the case of lacking the sensors inside the vacuum chamber.
The optical lattice clock has widely been recognized to be one of the most precise frequency standards in recent years.[1–6] The two-valence-electron atoms, such as Sr, Yb, Hg, etc., can serve as stable and accurate frequency references because of their having narrow 1S0–3P0 optical transitions. Based on the 5s2 1S0–5s5p 3P0 transition of ultracold 87Sr atoms confined in a one-dimensional optical lattice, the optical frequency standard pursued by Bloom et al.[7] has been realized: the accuracy and stability are both at 10−18 level. It is widely known that atomic frequency reference is defined in a null-field and zero-temperature environment. However, in reality the optical clocks are mostly operated in an environment with the stray magnetic field at room temperature. Therefore the measured transition frequencies need correcting and the uncertainty of these corrections must be evaluated.
Previously, the blackbody-radiation (BBR) shift was estimated through the temperature measurement and theoretical calculation,[8–12] and the temperature of the chamber was usually regarded as being isotropic. However, the experimental condition and the surrounding airflow can lead to the temperature inhomogeneity of the chamber, which can be obtained by more detailed measurements. Moreover, the temperature distribution of the outer surface may not reflect the real scenario inside the chamber. To deal with these problems, many efforts have been made to improve the BBR correction and its uncertainty. For the JILA 87Sr optical lattice clock, there is a BBR enclosure surrounding the vacuum chamber to maintain the environmental temperature, and two temperature probes are placed inside the vacuum chamber to detect the thermal environment near the atoms.[13] By using a different approach, the group of NIST developing the 171Yb optical lattice clocks placed a BBR shield into the vacuum chamber[14] to reduce the fluctuation and improve the homogeneity of the environmental temperature around the cold atoms, which furnishes the atoms with a uniform, well-characterized radiative environment. Applying the technique of the moving lattice, the 87Sr optical lattice clock located in RIKEN was examined in a cryogenic environment to reduce the BBR shift,[15] which is also called the cryo-chamber.
In this paper, we accurately evaluate the blackbody-radiation shift and its uncertainty in the 171Yb optical lattice clock by numerically simulating the temperature distribution around the cold ytterbium atoms based on the measured temperatures on the surface of the vacuum chamber. At first, we review the theoretical calculation of the BBR shift and introduce the experimental setup to display the external radiation sources in our experiment. Secondly, we present the temperature measurement scheme with using seven sensors to determine the chamber temperature distribution. Then, we calculate the BBR shift according to the analyses of heat sources and the measured chamber temperatures. Finally, we estimate the temperature distribution inside the chamber by numerical simulation, so that the temperature gradient and fluctuation around the cold atoms can be inferred more accurately. Furthermore, the BBR shift in the 171Yb optical lattice clock is evaluated and discussed.
Theoretically, the blackbody radiation field is equal in any direction, making vector and tensor components zero. The temperature dependence of the clock scalar BBR shift is given by the formula:[16,17]


Figure
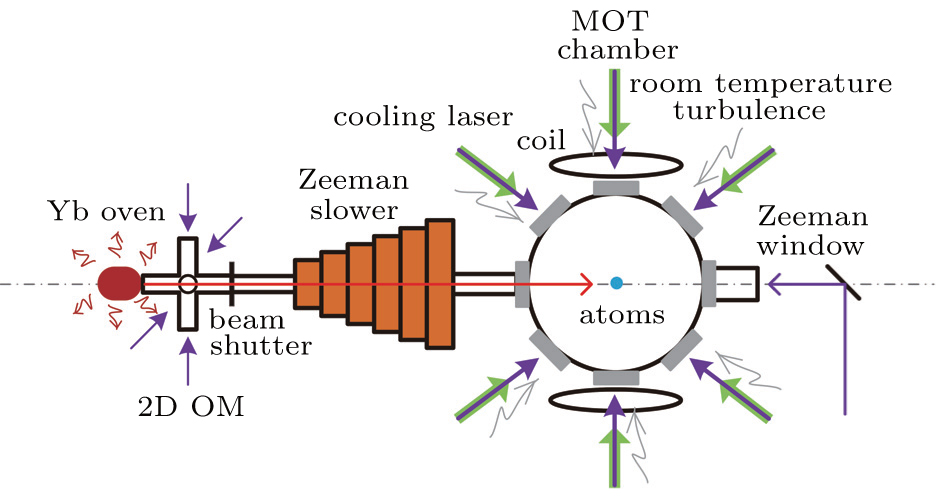 | Fig. 1. Experimental setup of the 171Yb optical lattice clock. The 171Yb atoms from the heated oven pass through the two-dimensional (2D) collimation, Zeeman slower system, and finally enter into the magneto–optical trap (MOT) area. The atomic oven is heated to 673.15 K (400 °C) during the operation, and both the Zeeman slower and MOT chamber are exposed to the room temperature. |
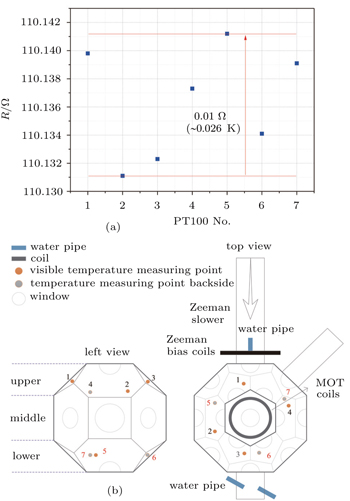
As mentioned above, the temperature of the radiation source will directly affect the BBR shift. It is necessary to define the temperature of the heat source. The atomic oven is covered by a sleeve which is heated by electrodes. Two thermocouples are inserted into the sleeve for monitoring the oven temperature in time. The oven temperature can be regarded as being the same as the sleeve temperature because they are tightly attached to each other. The beam shutter is located between the oven nozzle and the Zeeman slower, and its temperature is very close to the oven temperature. To determine the actual temperature of the vacuum chamber, seven platinum resistance thermometers (PRTs) are tightly attached to the outer surface at different spots of the metal chamber to obtain both temperature values and their fluctuations. The sensors are made by Heraeus Sensor Technology, and the accuracy of the PRTs is class 1/10B (AAA) which leads to the temperature measurement error being ± 0.04 K less than the standard value. The three performance coefficients of each PRT are calibrated by the Shanghai Institute of Measurement and Testing Technology (SIMT). The discrepancies among seven PRTs are shown in Fig.
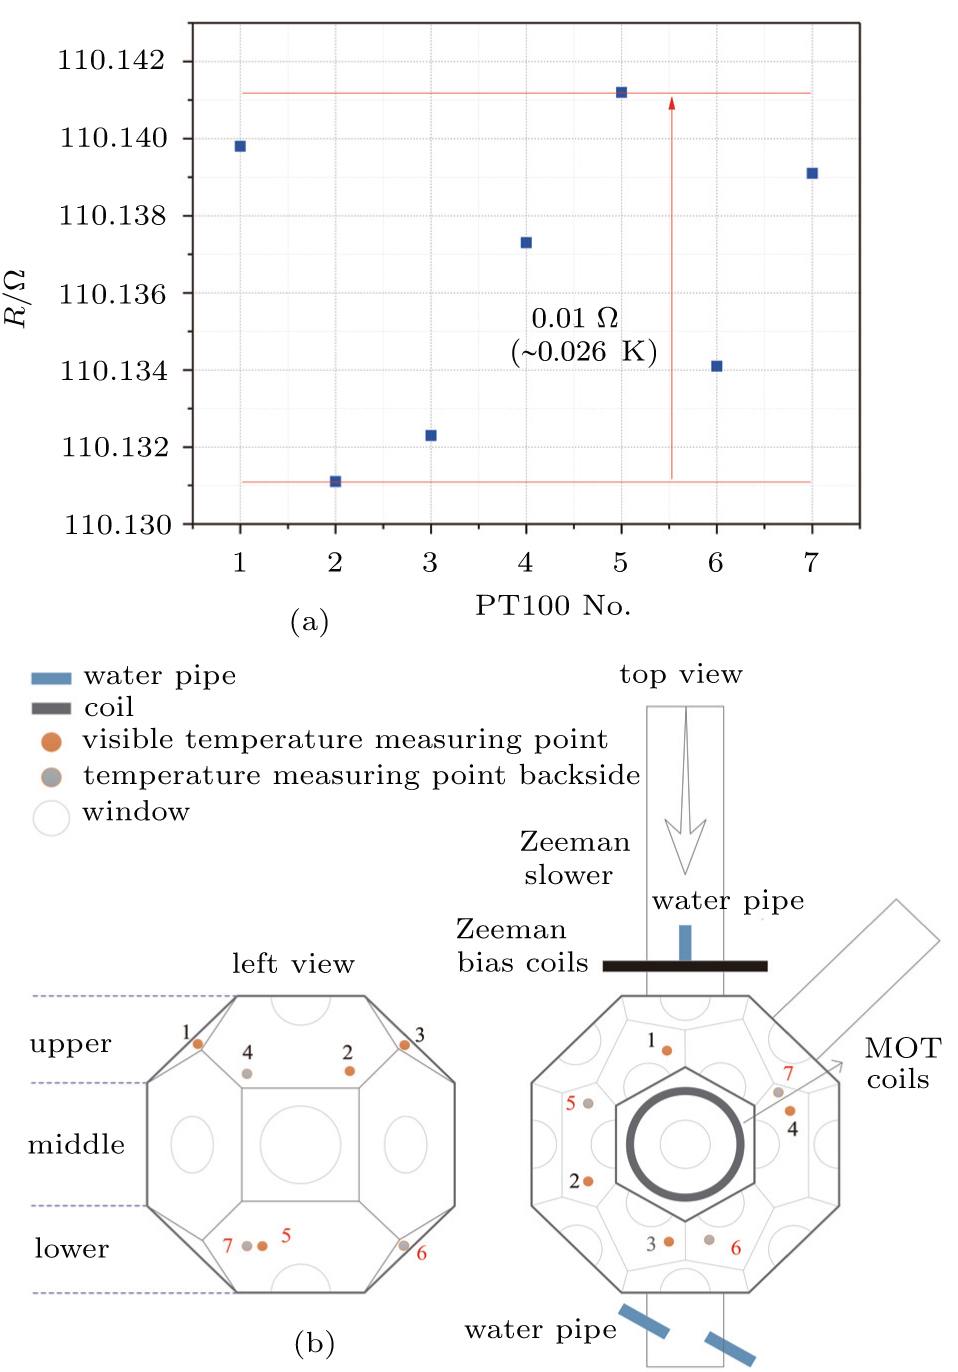 | Fig. 2. (a) Discrepancies among seven PRTs tested by SIMT (Shanghai Institute of Measurement and Testing Technology). The largest resistance difference is 0.01Ω which will lead the temperature difference of ∼ 0.026 K. (b) Distribution diagram of the PRTs on the outside surface of the vacuum chamber. There are only three points on the lower part because of the space limitation while there are four on the upper part. |
We monitor the temperature of the vacuum chamber in the whole clock operation process. Despite the fact that we use the recycled water of 293.15 K (20 ° C) to cool the apparatus, the temperature of the chamber is still about 6 K higher than the cooling water temperature when the MOT coils run with a current of ∼ 8 A.
Figure
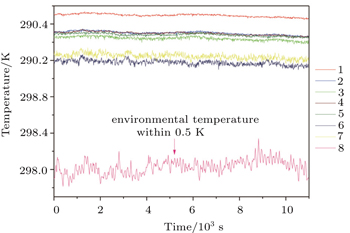
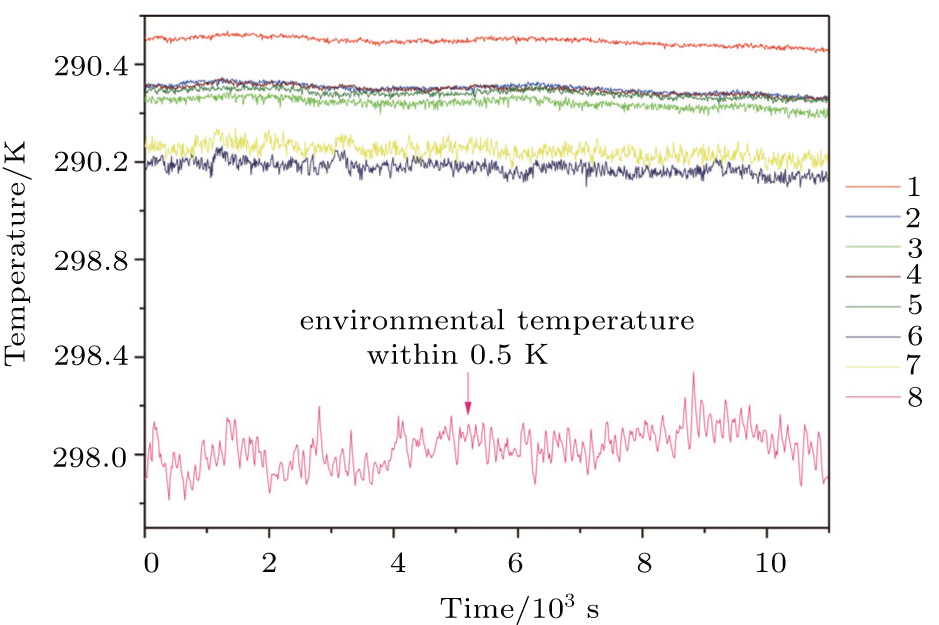 | Fig. 3. Variations of chamber temperature with time, measured by seven PRTs (Nos. 1–7) during the clock-operation period. The extra PRT (No. 8) is utilized to measure the environmental temperature surrounding the chamber. |
The measured values are listed in Table
| Table 1. Temperature differences among seven PRTs during the clock-operation period. “Range” refers to the difference between maximum and minimum temperatures of each PRT. “Average” means the mean temperature of each PRT. . |
Table
| Table 2. Uncertainties of the chamber temperature for calibrated PRT. The uncertainty values in the calibration are offered by SIMT. The temperature fluctuation uncertainty of the temperature measurement comes from Table |
According to the structure of our experimental apparatus, the BBR shift in the 171Yb optical lattice clock mainly results from three radiation sources: the room temperature effect through the windows of the vacuum chamber, the radiation reflection of the cavity inner surface, and the radiation emitted from heated atomic oven. We simply model the vacuum chamber as a spherical cavity with a radius of 9.5 cm. There are two kinds of windows on the chamber: (i) seven 1.5-inch (1 inch = 2.54 cm) windows for the cooling lasers at 399 nm and 556 nm; (ii) twelve 0.5-inch windows for the optical-lattice lasers at 759 nm, the clock laser at 578 nm, the repumping lasers at 649 nm and 770 nm, and the detection laser at 399 nm.
In some cases, the windows of the vacuum chamber are assumed to be not transparent for the room temperature BBR,[2] but the effect exists because of the transmissivity of the window glass. The corresponding frequency shift can be calculated according to the sold angle of the window:

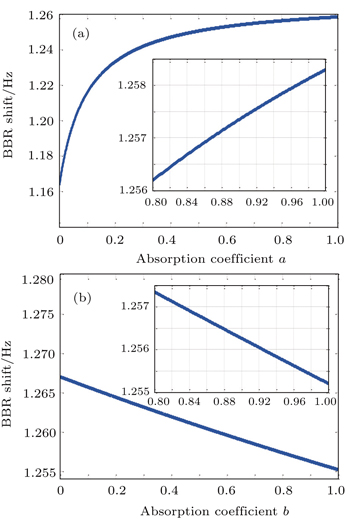
Most of the radiation entering into the chamber is absorbed by the inner surfaces of both the chamber and the windows, while a small part of the radiation may affect the atoms due to its reflection. Here, we apply a model including the inner surface absorption coefficients of both the cavity (a) and windows (b) under three assumptions: firstly, the total energy entering into the cavity is the same as that leaking out of the cavity during the clock-operation period; secondly, we assume that the diffuse reflection from the inner wall and the energy density ρcav are spatially homogeneous and isotropic; the last assumption is that the temperature of the cavity is finally balanced at Tcavity after being heated by the MOT coils nearly for 1.5 h. Under these assumptions, we can obtain the following energy rate equations:[25]


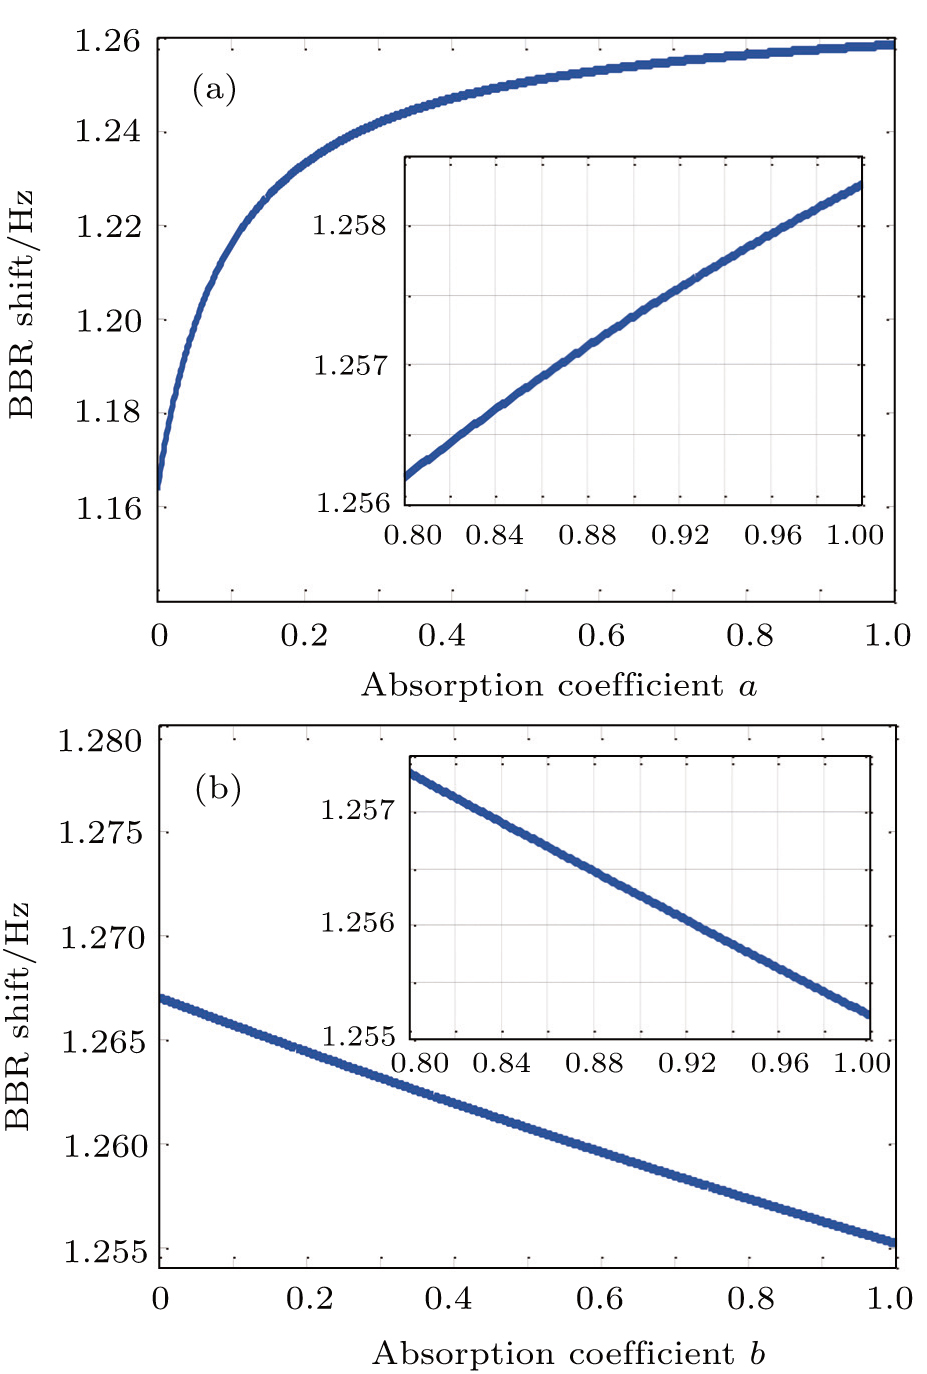 | Fig. 4. (a) Dependence of the BBR shift on the absorption coefficient a of the metal chamber while the coefficient b = 0.8. (b) Dependence of the BBR shift on the absorption coefficient b of the vacuum windows while the coefficient a = 0.9. |
Atomic oven is heated up to 673.15 K during the clock operation and becomes a radiation source near the main chamber. Fortunately, there is a beam shutter in front of the oven preventing the hot atoms from shocking the cold atoms and blocking most of the BBR photons from being scattered along the Zeeman slower pipe towards the optical lattice. Also, the beam shutter and the Zeeman slower are both installed with the recycled cooling water to reduce the influence of the heated oven. The radiation is limited by the aperture of the link pipe, which connects the Zeeman slower and main chamber. The residual radiation from the heated oven can be regarded as a surface emitting a different radiation spectrum at the temperature of the link pipe Tlink. We define the representative temperature Tlink as being the same as the temperature of sensor PRT (NO. 1) (299.69 K), whose position is quite close to the link pipe. The frequency shift induced by the oven is then determined by

Combing the effects of the three radiation sources, the total BBR induced frequency shift turns out to be −1.282(17) Hz with an uncertainty of 3.28 × 10⁻¹⁷. Here, we use the standard deviation to characterize the total uncertainty. The uncertainty comes from three factors: Δα(0), T, and η, and can be expressed as


Figure
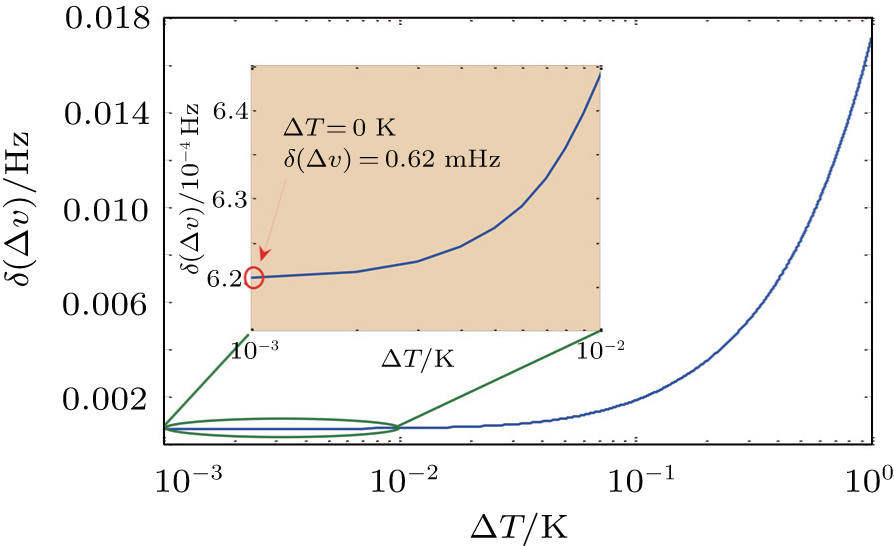 | Fig. 5. Dependences of δ(Δν) ∼ ΔT from 0 K∼1 K while the room temperature is 299.43 K. The diagram on the top left corner shows δ(Δν) ∼ ΔT dependence from 0 K∼0.1 K where the shift is 0.62 mHz when ΔT = 0 K. |
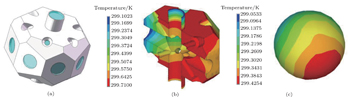
Certainly, the discussion above is based on the simplified hollow sphere model which is far from the real case. To address this issue, we build the chamber model by Solid Works according to the trim size with twenty two sections which is shown in Fig.
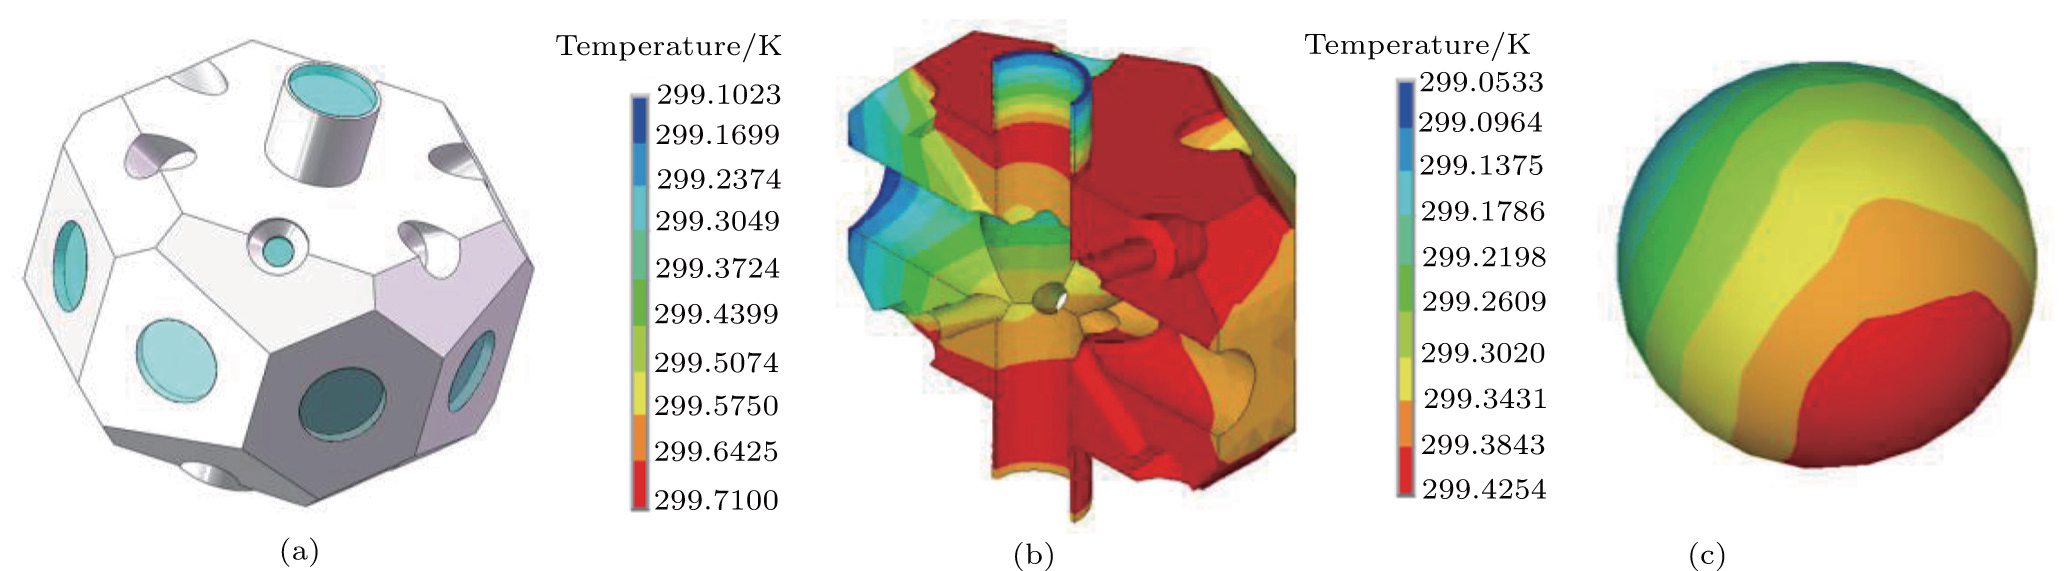 | Fig. 6. (a) Chamber model built according to the trim size. The flanges for pressing the windows are ignored because of the complex structures. (b) Temperature distribution of the metal chamber caused by heat conduction and convection while the environmental temperature is 293.15 K. The chamber is placed on the platform with one side exposing near the air outlet. That is the reason why the left side (blue) in the graph is cooler than the right side (red), while the upper side (green) is cooler than the lower side (red). (c) The temperature distribution around the cold atoms while the environmental temperature is 293.15 K. |
The vacuum part is empty while the atoms are replaced by a blackbody sphere. The setting values of the material model in ANSYS are limited to an effective range. The radiation loading is added to the inner surface of the chamber so that the temperature gradient around the cold atoms can be inferred. The convective heat transfer coefficient is not uniform because of the unilateral bigger airflow. The convergent nonlinear analysis gives the temperature distribution near the cold atoms, which is shown in Fig.
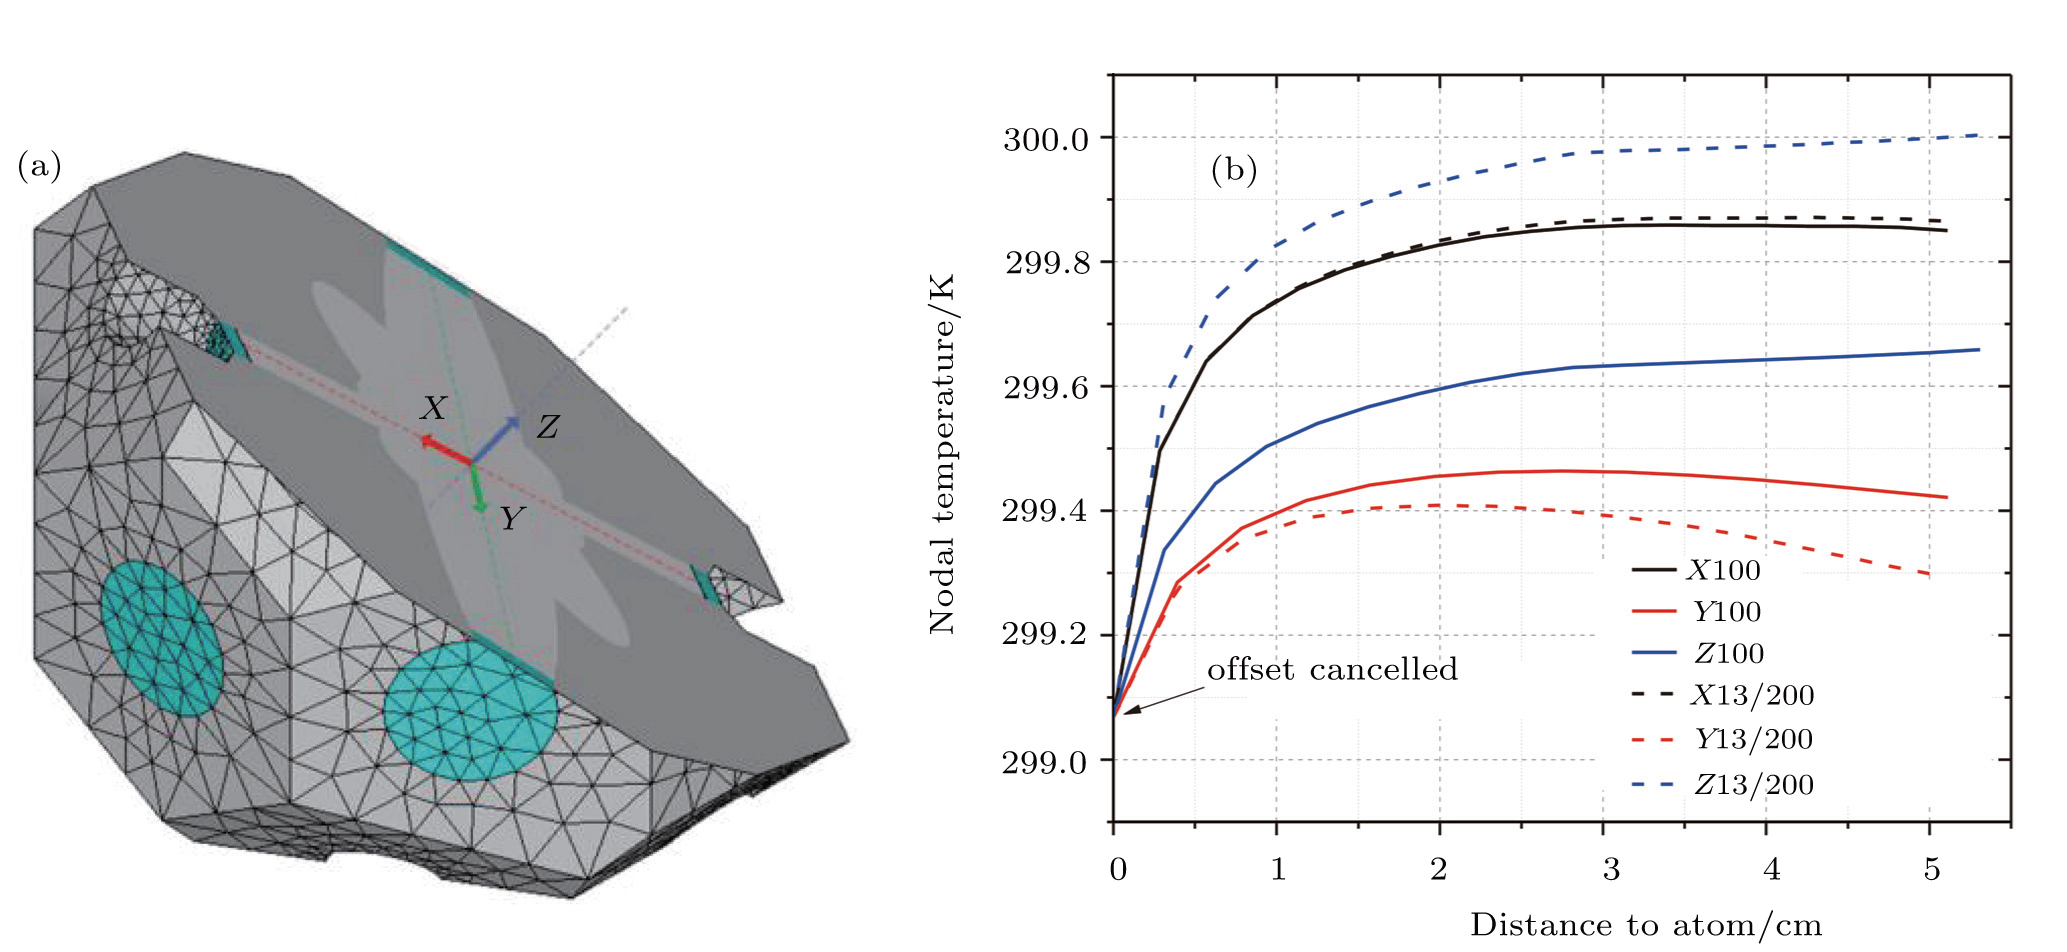 | Fig. 7. (a) Defined local coordinate system where X is along the lattice laser. (b) Differences of the temperature gradients near the cold atoms where the convection is uniform or not. The solid lines represent that the heat convection is uniform with the convective heat transfer coefficient of 100 W/(m2·K). The dash lines represent that the heat convections are inhomogeneous with the convective heat transfer coefficients of 13 W/(m2·K) and 200 W/(m2·K), respectively. |
We simulate the temperature distribution of the blackbody sphere when the environmental temperature changes from 292.65 K to 294.65 K. Finally we take the largest temperature difference value of 0.082 K all around as the temperature variation at the cold atoms. Adding the effect of the room temperature through the vacuum windows and the heated oven, the total BBR shift obtained from the simulation is −1.289(7) Hz, and the corresponding uncertainty of the BBR shift is 1.25 × 10⁻¹⁷. For comparison, if directly using the measured temperatures of the outer surface without simulation, the total BBR shift is −1.282(17) Hz with an uncertainty of 3.28 × 10⁻¹⁷. Obviously, they are different, and the former is more accurate than the latter, because the presented method is more realistic to describe the temperature distribution around the cold atoms.
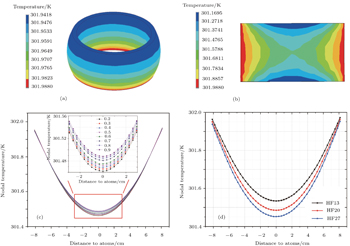
To evaluate the accuracy of the presented method, we simulate the temperature gradient and compare the results with the measured values at the Sr clock in JILA.[7] Firstly, we build a simplified vacuum chamber according to the shape described in Ref. [13], in which the flanges and small windows in the horizontal direction are ignored. Then we apply the loadings according to the measurement conditions. As mentioned in Ref. [7], the temperature of the bottom window was varied from 301 K to 302 K, and the temperature gradient near the atoms was measured by two sensors. Thus the temperature loadings in our model are in two areas on the flanges of the bottom window with a temperature of 302 K. The initial convective heat transfer coefficient is set uniformly to be 13 W/(m2·K) because there is a BBR shield around the whole chamber. The vacuum part is also filled with an entity with the characteristics of the vacuum. The radiation loadings are added on the inner surface of the metal chamber with an absorption coefficient of 0.8 initially. The temperature distribution of the metal chamber is shown in Fig.
 | Fig. 8. (a) Temperature distribution of the metal chamber. (b) Temperature distribution of the vacuum entity. (c) The relationship between the radiation coefficient and temperature gradients with the convective heat transfer coefficient being 13 W/(m2·K). (d) The relationship between the convective heat transfer coefficient and temperature gradients with the absorption coefficient being 0.8. HF means the convective heat transfer coefficient and it is in units of W/(m2·K). |
Through the simulation and analysis above, we find that the main drawback is the temperature inhomogeneity of the vacuum chamber. Therefore, in the next research we need to improve the homogeneity of the vacuum chamber, say, by rearranging the positions of the air conditioners. Furthermore, we plan to increase the flow rate of the cooling water so that the heating effect of the MOT coils could be reduced and the vacuum chamber temperature can be lowered. To improve the present status further, a radiation shield could be built inside the vacuum chamber to avoid the room temperature influence, and thus the temperature uncertain value will only be limited by the inhomogeneity of the shield which may be reduced down to 0.1 K. In this case, the uncertainty of the BBR shift could reach 1.14 × 10⁻¹⁷. On the other hand, we will improve the simulation. For instance, we will optimize the chamber model and surface parameters to take more radiation factors into account. Ultimately, we will upgrade our apparatus, such as installing the temperature probers inside the vacuum chamber or making the cyro-chamber, etc, which have been done successfully by other groups.[13–15]
The BBR shift results from various sources which come from inside and outside of the experimental apparatus, and at present it is one of major obstacles for improving the accuracy of the optical lattice clocks. Many schemes of dealing with the BBR shift come up, each with its own advantages. For the JILA Sr lattice clock, the inner sensors can accurately measure the temperature near the atoms during the experiment so that the BBR correction can be accurately calculated.[13] The BBR shield installed inside the vacuum chamber of the NIST Yb clock provides a uniform radiative environment for the atoms at room temperature, so that the temperature fluctuation around the cold atoms is reduced.[14] The cryo-chamber realized by the group of RIKEN Sr clock is an effective method to reduce the BBR shift while the environmental temperature can be maintained at 95 K by the compressor with a negligible temperature fluctuation.[15] In this paper, we present a more precise evolution of the BBR shift by using the numerical simulation combined with the temperature measurement on the outer surface of the chamber. With the assistance of the numerical simulation, we obtain the temperature distribution inside the vacuum chamber and calculate the BBR correction more accurately, which is −1.289(7) Hz with an uncertainty of 1.25 × 10⁻¹⁷ governed by a temperature inhomogeneity of ΔT = 0.3791 K. Definitely the simulation could help us know the radiation environment around the cold atoms more unmistakably. Finally, we believe that this method will be quite suitable for precisely evaluating the BBR shift of the optical lattice clock where there are no sensors inside the vacuum chamber.
| 1 | |
| 2 | |
| 3 | |
| 4 | |
| 5 | |
| 6 | |
| 7 | |
| 8 | |
| 9 | |
| 10 | |
| 11 | |
| 12 | |
| 13 | |
| 14 | |
| 15 | |
| 16 | |
| 17 | |
| 18 | |
| 19 | |
| 20 | |
| 21 | |
| 22 | |
| 23 | |
| 24 | |
| 25 |