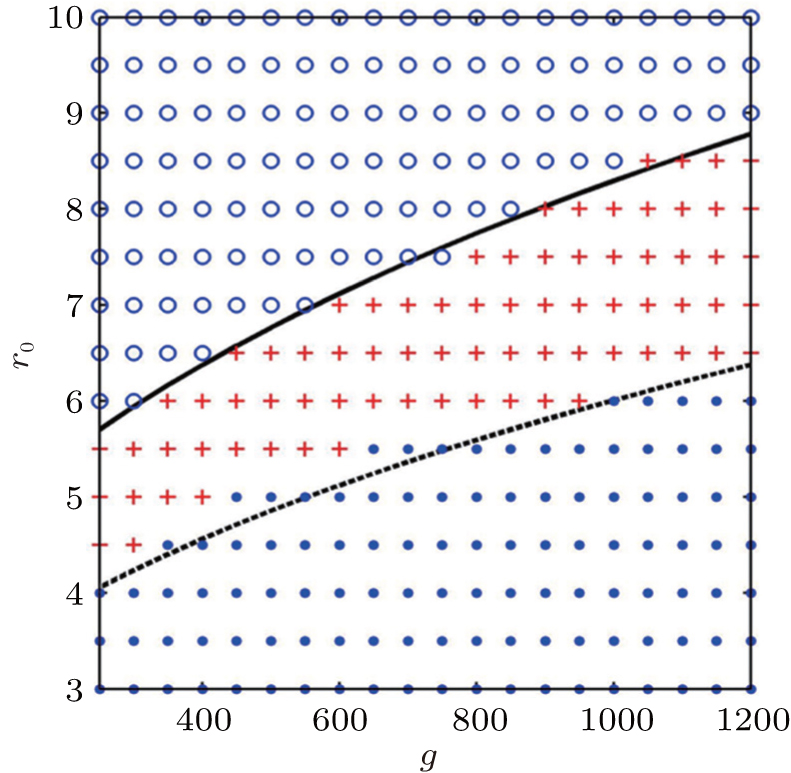
The ground states and pseudospin textures of rotating two-component Bose–Einstein condensates trapped in harmonic plus quartic potential

The ground states and pseudospin textures of rotating two-component Bose–Einstein condensates trapped in harmonic plus quartic potential |
 |