† Corresponding author. E-mail:
Project supported by the National Natural Science Foundation of China (Grant Nos. 11472254 and 11272006).
We conduct molecular dynamics simulations of the ejection process from a grooved Pb surface subjected to supported and unsupported shock waves with various shock-breakout pressures (PSB) inducing a solid–liquid phase transition upon shock or release. It is found that the total ejecta mass changing with PSB under a supported shock reveals a similar trend with that under an unsupported shock and the former is always less than the latter at the same PSB. The origin of such a discrepancy could be unraveled that for an unsupported shock, a larger velocity difference between the jet tip and its bottom at an early stage of jet formation results in more serious damage, and therefore a greater amount of ejected particles are produced. The cumulative areal density distributions also display the discrepancy. In addition, we discuss the difference of these simulated results compared to the experimental findings.
Ejecta produced from a shock-driven metal surface, originating from the interaction between a reflected release wave and surface defects, is an important fragmentation process in shock physics, which plays a determinative role in affecting the surface measurements and performance of inertial confinement fusion. Previous experiments[1–10] had indicated the various factors such as surface perturbation of machined metals, material phase, and shockwave profile having a pronounced effect on the total ejected mass, the ejecta density, and velocity distributions, which are expectedly predicted by performing an ejecta term source model in hydrodynamic simulations.[7,11] Nevertheless, there have only been a few systematic investigations of the influence of the loading shockwave profile on ejecta production in spite of its importance pointed out again in the Introduction of a recent paper.[10]
In experiments, a supported shock having a flat top portion is created by a gas gun and an unsupported shock characterized by a decaying impulse with the time is generated by a high explosive or a pulsed laser.[9] An unsupported shock is sometimes referred to as a Taylor or triangular wave. Experimental observations[12,13] have shown a strong dependence of the damage evolution process on the shock loading profiles. For ejecta production,[5,6] the total ejected mass increases linearly for a supported shock while showing a steep rise followed by a constant slope for an unsupported shock with respect to the shock-breakout pressure (PSB) when Sn is shocked from a solid state to a mixed solid–liquid state. Several possible reasons are proposed to explain this difference, such as the time-dependent influence of the shock profile on the instability formation and micro-spall separation of layers induced by the stress state upon release at the free surface. As a helpful complement for modeling the ejecta production related to melting and damage,[14–22] molecular dynamics (MD) simulations have been carried out to comparatively obtain the quantity of ejecta in Al for supported and unsupported shocks.[19] The simulations exhibit a continuous increase of microjet mass with the increasing shock pressures under supported shocks and this quantity after release melting is larger than that under unsupported shocks. However, careful examination finds that the mass determination in Ref. [20] is for the jet but not for the ejected fragments. Thus, both the experimental measurements and numerically atomistic simulations cannot offer an explicit insight on the influence of shockwave shape on the ejection process, in particular regarding the quantity of the ejecta production.
The goal of the present work is to address the influence of shock wave profile on the ejection process from shocked Pb metal using MD simulation, with an emphasis on the quantity of the ejected fragments as well as the ejecta mass–velocity distribution. The total ejected masses for supported and unsupported shock waves are determined and reveal the distinct findings in contrast to the past experiments[5,6] and simulations[19] when Pb goes from a solid phase to a full melting phase. Moreover, we elucidate the difference by analyzing the evolution process of the ejecta produced.
The MD simulations are implemented with the free source code Large-scale Atomic/Molecular Massively Parallel Simulator (LAMMPS).[23] The modeling domain filled with fcc Pb atoms is 118 × 60 × 7 nm3 with about 1.65 × 10⁶ atoms, in which surface perturbation consists of six triangular grooves calibrated with each dimension of 10 nm in height and 53.1° in groove angle. This simulated model is the same as in Ref. [20] where ejecta production under an unsupported shockwave has been examined. The X, Y, and Z axes are chosen along the [100], [010], and [001] directions, respectively. Periodic boundary conditions are imposed along the Y and Z directions, while the shock direction (X axis) is kept free. The interatomic potential for single-crystalline Pb is adopted with an embedded atom method (EAM) potential by Zhou et al.,[24] which represents a good description of both solid and liquid phases of Pb as validated by the calculated Hugoniot pressure–temperature relation.[25] After constructing the initial sample, the system is equilibrated through the utilization of Nose-Hoover isobaric–isothermal ensemble (NPT) with a pressure of 0 bar (1 bar = 105 Pa) and a desired temperature of 100 K for 10 ps. The dynamic simulations adopt the microcanonical NVE ensemble integrating the equation of motion with a time step of 1 fs. By dividing the simulation cell into fine bins only along the shock direction (1D binning analysis) and ignoring the heterogeneities in the transverse direction, the average physical quantities are obtained in each bin, such as particle velocity and volume density. The Ovito software[26] is employed to visualize the atomic configuration.
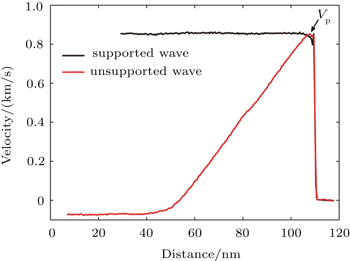
In order to generate a shock impulse, the piston by choosing the first 1 nm of the sample is given an impact velocity to drive the remaining sample. By keeping a constant velocity of the piston with a square pulse of 8 ps followed by releasing it, the rarefaction wave from the rear of the sample is formed to catch up with the shock wave. Once the release wave overtakes the shock wavefront, the unsupported shockwave profile is achieved before reflection at the groove bottom. In this case, a peak velocity denoted as Vp, is reduced in comparison to the incident loading velocity, also including a drop in peak pressure. The peak pressure is defined as the shock-breakout pressure PSB proposed in the experimental studies,[2,4,5] where it is worth noting that ejecta production is dependent on PSB not the incident pressure. To quantitatively compare the results, a supported shock is generated by the piston loading with a continuous velocity equal to Vp obtained from the unsupported shocks, ensuring the same PSB for both shocks.
Figure
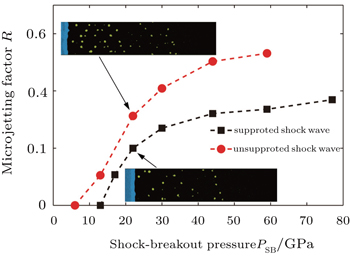
After running a long enough simulation time imposed by these two shockwaves, the ejected particles are completely broken away from the bulk, as observed from the inset of Fig.
By defining the microjetting factor R as the ratio of the ejected mass to the missing mass related to the groove volume, we could obtain R as a function of PSB for supported and unsupported shock waves, as shown in Fig.
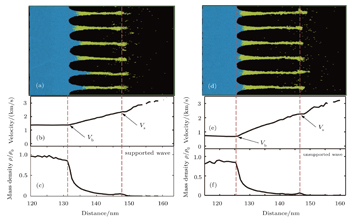
To explicitly make the explanation for difference shown in Fig.
We further plot the spike and bubble velocity evolutions under these two shocks in Fig.
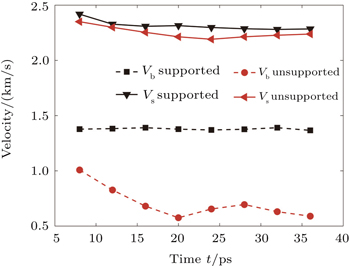 | Fig. 4. The spike and bubble velocities evolution for the jets are plotted. It is evident that there exists a larger velocity difference between the jet tip and its bottom for unsupported shocks. |
Actually, the above analysis could be extended for all the events displayed in Fig.
Compared to the MD simulations which accurately acquire the amount of the ejecta, the experiment captures this quantity directly from the areal density distribution, which integrates the volume density distribution beginning from the jet tip. This is an accumulated quantity representing the ejecta mass along the ejected direction. Figure
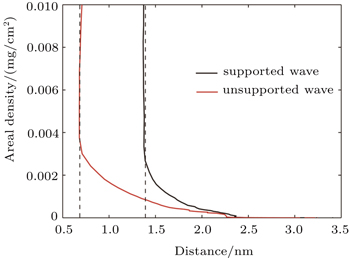 | Fig. 5. The areal density distributions versus the ejected velocity are presented. The dashed line marks the bubble velocity for the jets. |
It could be seen from the above results that the whole analysis on the ejected process for unsupported and supported shocks is reasonable; however, the total ejected mass changed with PSB fully differ from the experiments of Sn sample.[5,6] The underlying origin is due to the fact that the shocked sample between experiments and simulations undergoes the distinct loading histories. For the former, the shockwave decays very slowly and ejecta production is an instantaneous event, meaning that the ejecta formation time is a lot shorter compared to the shock travelling time within the bulk both for supported or unsupported shocks. Therefore, ejecta production mainly relies on the material state imposed by the first shock loading. For the latter, the shockwave loading time is short and ejecta production is a time-dependent process where the ejected time is comparable to the shock loading one. In this case, ejecta formation will be quickly affected by the following release wave from the back of the sample. This indicates that ejecta production in the MD simulation on such a small scale is associated with the material state and shockwave propagating process.
In conclusion, we have investigated the ejecta production from shocked Pb surface imposed by supported and unsupported shockwave loadings via molecular dynamics simulations. For the sake of convenient comparisons, shock-breakout pressure PSB at the groove bottom is kept uniform for both shocks. The three phase states of solid, local melting and melt-on-shock for Pb metal are taken into account throughout the whole simulation. The simulated results show that total ejected mass for supported shocks is the same trend of increasing with PSB as that under unsupported shocks and the former is always less than the latter at the same PSB. The reason stems from a larger velocity difference between the jet tip and its bottom for unsupported shocks, which gives rise to the more serious damage and therefore more ejected fragments, as also observed in the spallation experiment.[12,13] The origin is that for unsupported shocks the release wave from the backside of the sample immediately reaches the jet bottom, rapidly decreasing its velocity. Additionally, we made an explicit explanation of the difference between the simulated results and the experiments, which arises from the far larger ratio of sample thickness to groove depth. This needs to be considered in the future MD studies related to the ejecta process in contrast to the experimental case. Of course, our simulations performed here provide a clear picture and physical understanding for ejecta formation under these two loading profiles, which contributes to the development of an eject source model. It is suggested that the simulated results herein could be experimentally validated by a laser driven shock[9] where the loading profile history is much closer to that via atomistic simulations.
| 1 | |
| 2 | |
| 3 | |
| 4 | |
| 5 | |
| 6 | |
| 7 | |
| 8 | |
| 9 | |
| 10 | |
| 11 | |
| 12 | |
| 13 | |
| 14 | |
| 15 | |
| 16 | |
| 17 | |
| 18 | |
| 19 | |
| 20 | |
| 21 | |
| 22 | |
| 23 | |
| 24 | |
| 25 | |
| 26 |


