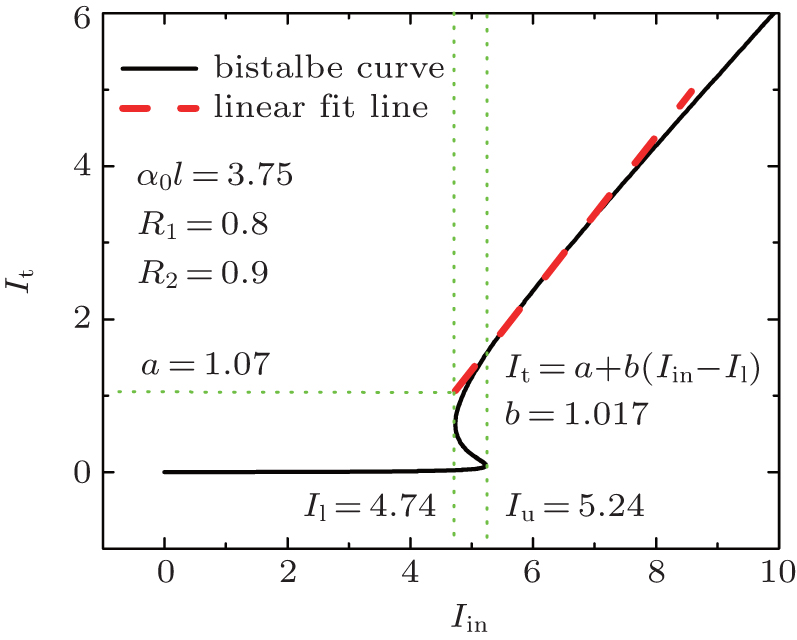
High contrast all-optical diode based on direction-dependent optical bistability within asymmetric ring cavity
Illustration of optical logic AND gate. We set

High contrast all-optical diode based on direction-dependent optical bistability within asymmetric ring cavity |
Illustration of optical logic AND gate. We set |
 |