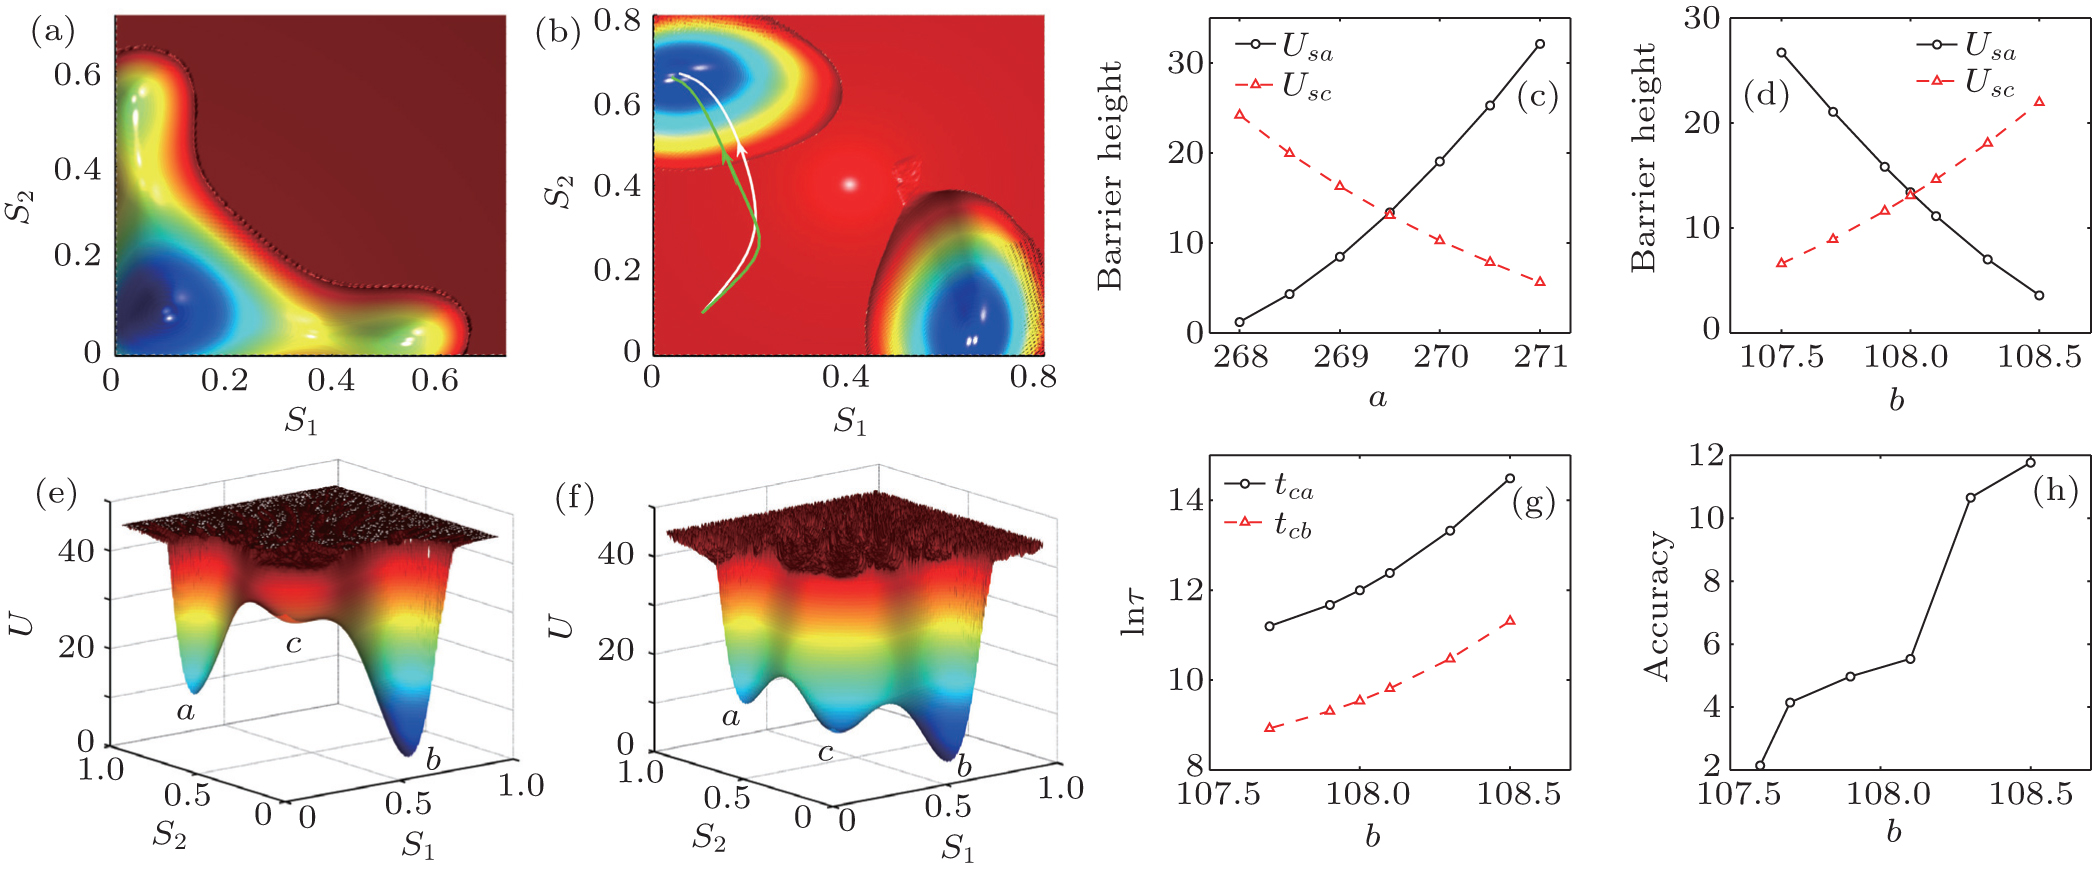
(a) The two-dimensional potential landscape for a higher input threshold before the stimulus inputs presented (μ0 = 0 Hz). (b) The two-dimensional potential and pathways for constant stimulus input μ0 = 30 Hz and different parameter b. The green line and white line show the decision-making pathways with different input threshold b/a where b = 108.5 and 107.5, respectively. In subgraphs (a) and (b), parameters a = 269.5 and b = 108 and the diffusion coefficient D = 3.6 × 10⁻⁷. (c), (d) The barrier heights versus parameters a and b, respectively. Here μ0 = 0 Hz, c′ = 0, and the diffusion coefficient D = 1.6 × 10⁻⁷. (e), (f) The potential landscapes for different input thresholds when a biased input is presented, where the parameter b = 107.5 and 108.5, respectively. Attractors a and b represent the incorrect choice state and correct choice state, respectively. c represents the undecided state. (g) The first passage time versus parameter b. (h) The ratio of the probability of the path of the correct choice to the error one versus parameter b. In subgraphs (e) and (h), parameters μ0 = 5 Hz, c′ = 0.24, D = 1.6 × 10⁻⁷, and a = 269.5. |

