† Corresponding author. E-mail:
Project supported by the Universiti Teknologi Malaysia (UTM) (Grant No. R. J1300000.7809.4F626). Dr. Samavati is thankful to RMC for postdoctoral grants.
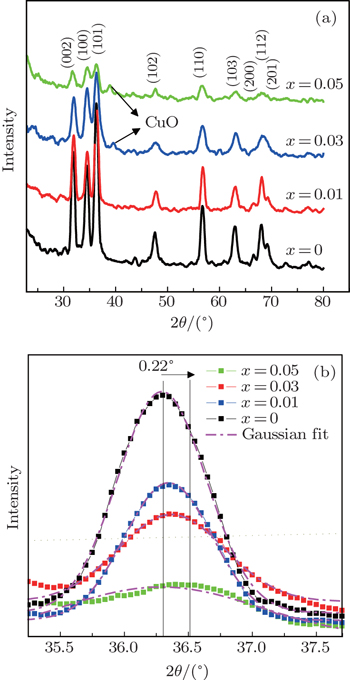
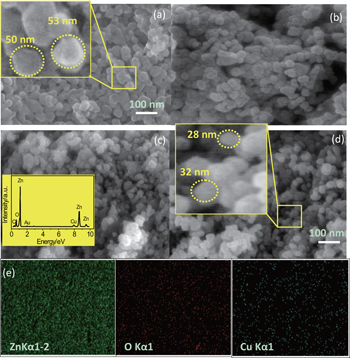
Zn1−xCuxO (x = 0.00, 0.01, 0.03, and 0.05) nanoparticles are synthesized via the sol-gel technique using gelatin and nitrate precursors. The impact of copper concentration on the structural, optical, and antibacterial properties of these nanoparticles is demonstrated. Powder x-ray diffraction investigations have illustrated the organized Cu doping into ZnO nanoparticles up to Cu concentration of 5% (x = 0.05). However, the peak corresponding to CuO for x = 0.01 is not distinguishable. The images of field emission scanning electron microscopy demonstrate the existence of a nearly spherical shape with a size in the range of 30–52 nm. Doping Cu creates the Cu–O–Zn on the surface and results in a decrease in the crystallite size. Photoluminescence and absorption spectra display that doping Cu causes an increment in the energy band gap. The antibacterial activities of the nanoparticles are examined against Escherichia coli (Gram negative bacteria) cultures using optical density at 600 nm and a comparison of the size of inhibition zone diameter. It is found that both pure and doped ZnO nanoparticles indicate appropriate antibacterial activity which rises with Cu doping.
ZnO has been the most commonly and extensively studied material in the field of nano science and technology. It is because of the unique characteristics of this material, such as extensive band gap energy (3.37 eV), electrical and thermal stability, large exciton binding energy (60 meV), and large saturation velocity (3.2 × 107 cm·s−1).[1] Due to these tremendous properties, ZnO nanoparticles have been extensively used in light-emitting diodes, laser diodes, solar cells, microelectronic, surface acoustic wave devices, hydrogen-storage devices, transparent electrodes, transparent thin-film transistors, antibacterial coating, UV protectors, targeted drug delivery and sensors.[2–5] ZnO is an inorganic antibacterial agent and has enormous advantages due to biocompatibility, action against bacteria in the neutral region (pH 7) even in darkness, non-toxicity to humans, ability to withstand harsh conditions, and being more durable compared to the conventional organic materials.[6] Therefore, these unique properties make it the right candidate for antibacterial applications and suitable for industrial usage. For controlling the growth of ZnO nanostructures, several synthesis methods are developed including sol–gel, hydrothermal, solvothermal, sonochemical, combustion, magnetron sputtering, and pulsed laser deposition.[7–12] The crystallite size effects play a predominant role on the properties of ZnO particles especially in nanometric dimensions where defects become significant. Furthermore, doping of different elements is considered as a promising route to tune the properties of ZnO nanoparticles.[13–16] The different ionic radii of the dopants and zinc greatly affect the crystallite size and lattice parameters. Consequently, it is necessary to include these effects in the crystallite calculations. Crystallite size and lattice strain are the two main factors that lead to widening of the diffraction peaks. Lattice strain is originated from the lattice imperfection or dopants which in turn alter the peak intensity and position.[17] Moreover, the uniform and non-uniform strain change the peak position and increase the peak broadening respectively.
Recently, using metal oxides antibacterial coatings in order to prevent the infections in particular non-selective microbicides such as reactive oxygen species (ROS) has improved.[18] Although, antibacterial activity of pure ZnO has been studied in different morphologies using mechanisms such as generation of ROS, hydroxyl radicals, hydrogen peroxide, superoxide anions O2−, the release of Zn2+ ions, cell membrane damage, the accumulation of nanoparticles in cytoplasm and outer membranes, many scientists believe that these nanoparticles are known to be toxic for humans.[19–23] Our results illustrate that at a relatively low concentration of dopant, a respectable action against the bacterial pathogens takes place; this hypothesis is in agreement with many other reports.[24,25] Despite many efforts, the antibacterial potency of Cu-doped ZnO nanoparticles against bacterium is still far from being understood. Accurate synthesis methods and systematic characterizations are pre-requisite for such understanding. This study is an attempt to enhance and optimize the antibacterial behavior of ZnO nanoparticles through Cu doping. For this aim, nanoparticles of ZnO doped with Cu are synthesized via the sol-gel method and the effects of dopants concentration on the structural and optical behavior as well as antibacterial activity are investigated.
For synthesizing the ZnO nanoparticles, raw materials of zinc nitrate hexahydrate (Zn (NO3)2.6H2O), copper nitrate hexahydrate (Cu (NO3)2.6H2O), gelatin ((NHCOCH–R1)n, R1 = amino acid, Type A, Porsin), and distilled water are employed. A batch of 2g of the final product is acquired by dissolving the particular amount of copper and zinc nitrates into 20 ml of distilled water. The nitrates amount are measured according to the Zn1−xCuxO formula, where x = 0.00, 0.01, 0.03, and 0.05. Approximately 4 g of gelatin with the final ratio of 2:1 are slowly added to 60 ml of distilled water and then the solution is stirred at 80 °C in an oil bath. A clear solution is achieved after completely dissolving the gelatin in water. Then, Zn2+ and Cu2+ solutions are added to the gelatin solution. The temperature is kept constant at 80 °C for 6 hours. The mixture is continuously stirred to obtain a clear, viscose, and honey-like gel. In order to calcine, a small volume of the prepared gel was scrubbed on the alumina crucible’s inner walls before putting it into the furnace. The furnace temperature is kept at 600 °C for 2 hours with a heating speed of 5 °C/min.
The antibacterial activity of the prepared nanoparticles in the form of nanofluids is examined by calculating the growth curve of E. coli HB 101 protected in the LB broth medium.[26] The growth curves are obtained by determining the time growth of optical density (OD) for pure and Cu doped samples. The measurements are performed at 600 nm wavelength using a UV/Vis spectrophotometer (WPA LightWave S2000) at a frequency of once in an hour. For further analysis of the antibacterial properties of the samples, the following procedures is carried out. Briefly, the colloidal suspensions of the synthesized nanoparticles (2 mg/ml) are applied to agar plates in which E. coli bacterium is cultured. After 24 hours of incubation of the agar plates, the inhibition zone diameter is measured in millimeters (mm).
The structural properties of samples are investigated using Cu-K α radiation (0.154 nm) at 40 kV and 100 mA for x-ray diffraction (XRD) equipment built by a D8 Advance Diffractometer, Bruker, USA. The 2θ range is set to 20°–80° with a resolution and step size of 0.011° and 0.02°, respectively. The field-emission scanning electron microscopes (FESEM, JEOLJSM 6380LA) attached with EDX are employed for observing nanoparticles, size calculation, and elemental analysis. Fourier transformed infrared (FTIR) spectra are recorded using a Perkin Elmer 5DX FTIR. Room temperature photoluminescence (PL) spectra are recorded by employing a luminescence spectrometer (LS 55, Perkin Elmer, USA) under 239 nm excitation wavelength.
The powder x-ray diffraction patterns are used to study the structural properties and the phase purity of the samples. Figure
The enhancement of Cu contents causes a decrease in the intensity of all diffraction peaks. This diminution is ascribed to the impacts of defects or disorders created by the copper ions in the ZnO lattice structure. In addition, no signal of Cu related phase such as metallic copper, oxides of copper, or any binary zinc copper phase is identified for x = 0.01 sample, or the CuO peaks for the Cu-doped at x = 0.01 are too small to distinguish. This specifies that the Cu ions have substituted Zn sites without considerably altering the crystal structure of ZnO, which is associated to the fact that the ionic radius of Cu+2 (0.73 Å) is very close to that of Zn+2 (0.74 Å). Therefore, Cu can simply penetrate into ZnO crystal lattice. However, by increasing the doping percentage of Cu (x = 0.03), a very weak signal corresponding to CuO appears, and its intensity increases with further increase in Cu doping (x = 0.05). Therefore, it can be concluded that the segregating of CuO is started from x = 0.03 Cu concentration. It can be understood that for a smaller amount of Cu, its ions substitute well with Zn ions, but increasing Cu concentration causes a CuO cluster to form and isolate as an impurity phase.
The wurtzite lattice parameters such as the values of d, the distance between adjacent planes in the Miller indices (hkl) (calculated from the Bragg equation, nλ = 2d sinθ), lattice constants (a and c), and unit cell volumes are calculated from the lattice geometry equation[27]

The lattice parameters of the samples are recorded in Table
| Table 1. Cu concentration dependent nanoparticles XRD peak positions, lattice parameters, and volume. . |
Cu doping results in a decrease in the lattice parameters ‘a’ and ‘c’, as compared to un-doped ZnO. This is attributed to a little mismatch in ionic radius between Zn+2 and Cu+2. However, a systematic variation in lattice parameters with increasing Cu content does not exist. The c/a parameter is close to the value of 1.633, which indicates the existence of a close packed hexagonal structure.
The size of nanoparticles calculated using the x-ray line broadening method via the Scherrer equation (D = kλ/β cosθ), where k is a constant equal to 0.94, D and λ are the particle size in nanometers and wavelength of the radiation (1.54056 Å for Cu Kα radiation), respectively. β and θ are the peak width at half-maximum intensity and peak position, respectively. The instrument and sample both affect the Bragg peak FWHM and the broadening in the XRD peaks is a combination of them. For decoupling these contributions and determining the instrumental broadening, a diffraction pattern from the line broadening of a standard material such as silicon needs to be assembled. The instrument modified broadening (βD) corresponding to the diffraction peak of ZnO nanoparticles with a Gaussian profile is estimated using the following equation:

Therefore, the Scherrer equation is modified as follows:

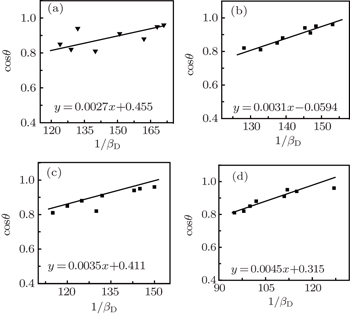 | Fig. 2. Plot of cosθ against 1/βD (Scherrer) for all prepared samples. (a) x = 0, (b) x = 0.01, (c) x = 0.03, and (d) x = 0.05. |
The morphology and chemical composition of the synthesized nanoparticles are examined via FESEM coupled with EDX. The top view FESEM images of pure and Cu-doped ZnO with various concentrations of Cu (x = 0.01, 0.03, and 0.05) as well as EDX mapping for the x = 0.03 sample are presented in Fig.
The presence of Cu and its homogenous distribution into ZnO nanoparticles is confirmed with the help of the EDX technique. Furthermore, the EDX spectra indicate that the nanoparticles are composed of Zn, O, Cu, Au, and C. A weak peak for C and Au is attributed to the supporter carbon tape and Au thin coating for FESEM image purpose.
Figure
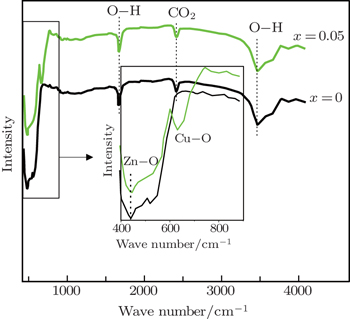 | Fig. 4. FTIR spectra of pure and doped (x = 0.05) ZnO nanoparticles. Inset: the same FTIR spectra in the range of 400–900 cm−1. |
Figure
 | Fig. 5. Room temperature PL spectra of Cu-doped ZnO nanoparticles at different concentrations. Inset shows the band structures and possible electron and hole recombination. |
The near-bandgap PL spectrum of all samples shows a broad band which is related to the superposition of the band originated from recombination of free excitons with its longitudinal optical (LO) phonon. In addition, the PL spectra of sample x = 0.05 exhibit a broad band with the maximum at ∼ 2.4–2.5 eV energy (see Fig.
UV–vis photons are passed through the pure and Cu-doped ZnO nanoparticles for further understanding of optical properties. Figure
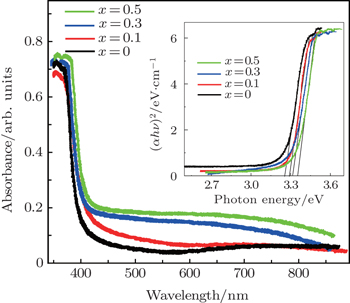 | Fig. 6. Cu concentration dependent UV–visible absorption spectra of ZnO nanoparticles. Inset shows the bandgap value for samples calculated using Tauc’s method. |
Through developing the microorganism’s resistance against the majority of antibiotics, the advanced research for finding a novel antibiotic becomes inevitable. Therefore, the present work is carried out to find the effect and properties of Cu-doped ZnO nanoparticles having different Cu concentration on killing curves of bacterial pathogens. The growth curve of E. coli bacteria in the presence of pure and Cu-doped ZnO nanoparticles with different dopant concentrations are illustrated in Fig.
 | Fig. 7. Cu concentration dependent antibacterial activities of Cu-doped ZnO nanoparticles. Inset shows the sample plot of optical density in the range of 0–0.5 for better evaluation. |
The disc diffusion method is adopted to examine the in vitro antibacterial activity of the synthesized nanoparticles against multi-drug resistant E. coli bacteria. Figure
Pure and Cu-doped ZnO nanoparticles are synthesized via a facile yet accurate sol-gel method. The considerable influences of Cu dopants on the spectroscopic characteristics and antibacterial activities are demonstrated. The incorporation of Cu in the ZnO matrix is found to alter the crystalline structures via defect mediated strain interactions and broadens the spectral width. This in turn modifies the lattice parameters and elastic constants of the single crystalline nanoparticles phase. The nanoparticles size estimation through different methods reveals consistent measures. The XRD measurement exhibits the wurtzite structure for Zn1−xCuxO without any pyrochlore phase at calcination temperatures of 600 °C. The XRD broadening is analyzed using the Scherrer plot. The crystallite size decreases from ∼ 52 to ∼ 30 nm with the increase of dopant (Cu) concentrations. The band gap energy calculated using PL and absorption spectra is blue shifted by increasing the Cu concentration. Furthermore, the bactericidal property is found to be concentration dependent and ZnO nanoparticles with 5% Cu dopants (x = 0.05) show the maximum inhibition against bacterial growth. Consequently, we can propose that Cu-doped ZnO nanoparticles can be used as an ingredient for the dermatological applications in lotions, creams, ointments, or other biomedical applications.
| 1 | |
| 2 | |
| 3 | |
| 4 | |
| 5 | |
| 6 | |
| 7 | |
| 8 | |
| 9 | |
| 10 | |
| 11 | |
| 12 | |
| 13 | |
| 14 | |
| 15 | |
| 16 | |
| 17 | |
| 18 | |
| 19 | |
| 20 | |
| 21 | |
| 22 | |
| 23 | |
| 24 | |
| 25 | |
| 26 | |
| 27 | |
| 28 | |
| 29 | |
| 30 | |
| 31 | |
| 32 | |
| 33 | |
| 34 | |
| 35 | |
| 36 | |
| 37 | |
| 38 |


