Thermally induced native defect transform in annealed GaSb

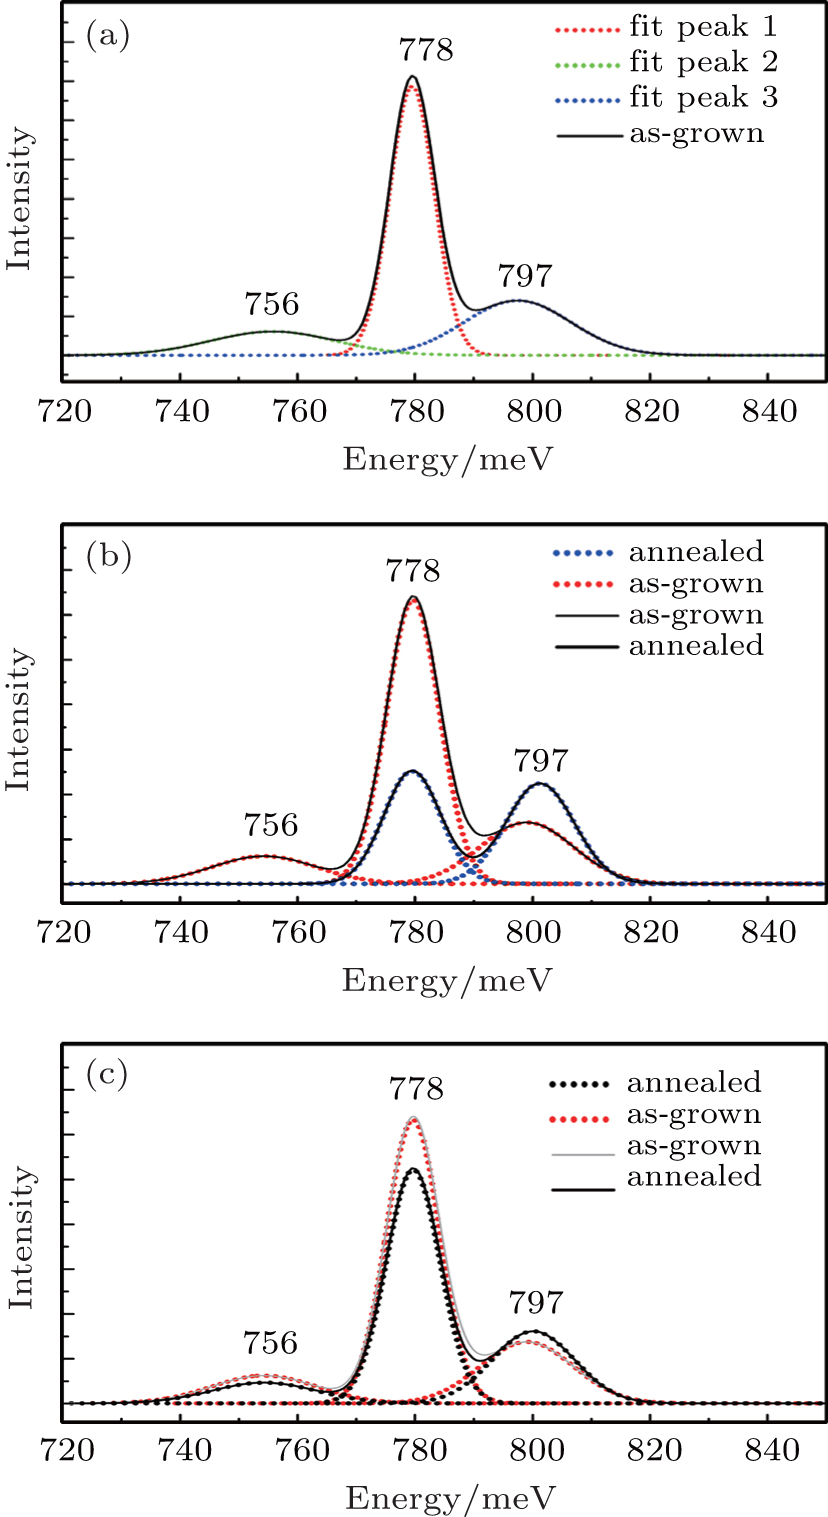
PL spectra of undoped GaSb samples. (a) As-grown sample. Gaussian deconvolution of the spectrum reveals emission bands centered at 756 meV, 778 meV, and 797 meV (dashed lines). The solid line is the best-fit curve which corresponds to the experimental data. (b), (c) A comparison of as-grown and annealed samples. Gaussian deconvolution of the spectra recorded for the samples annealed at 500 °C (black dashed line), 550 °C (blue dashed lines), and as-grown sample (red dashed lines) is shown. Emission bands centered at 778 meV and 797 meV appear. The spectrum of the sample annealed at 600 °C has hardly any improvement compared to that of the sample annealed at 550 °C, thus it is not shown. The solid line is the best-fit curve which corresponds to the experimental data.