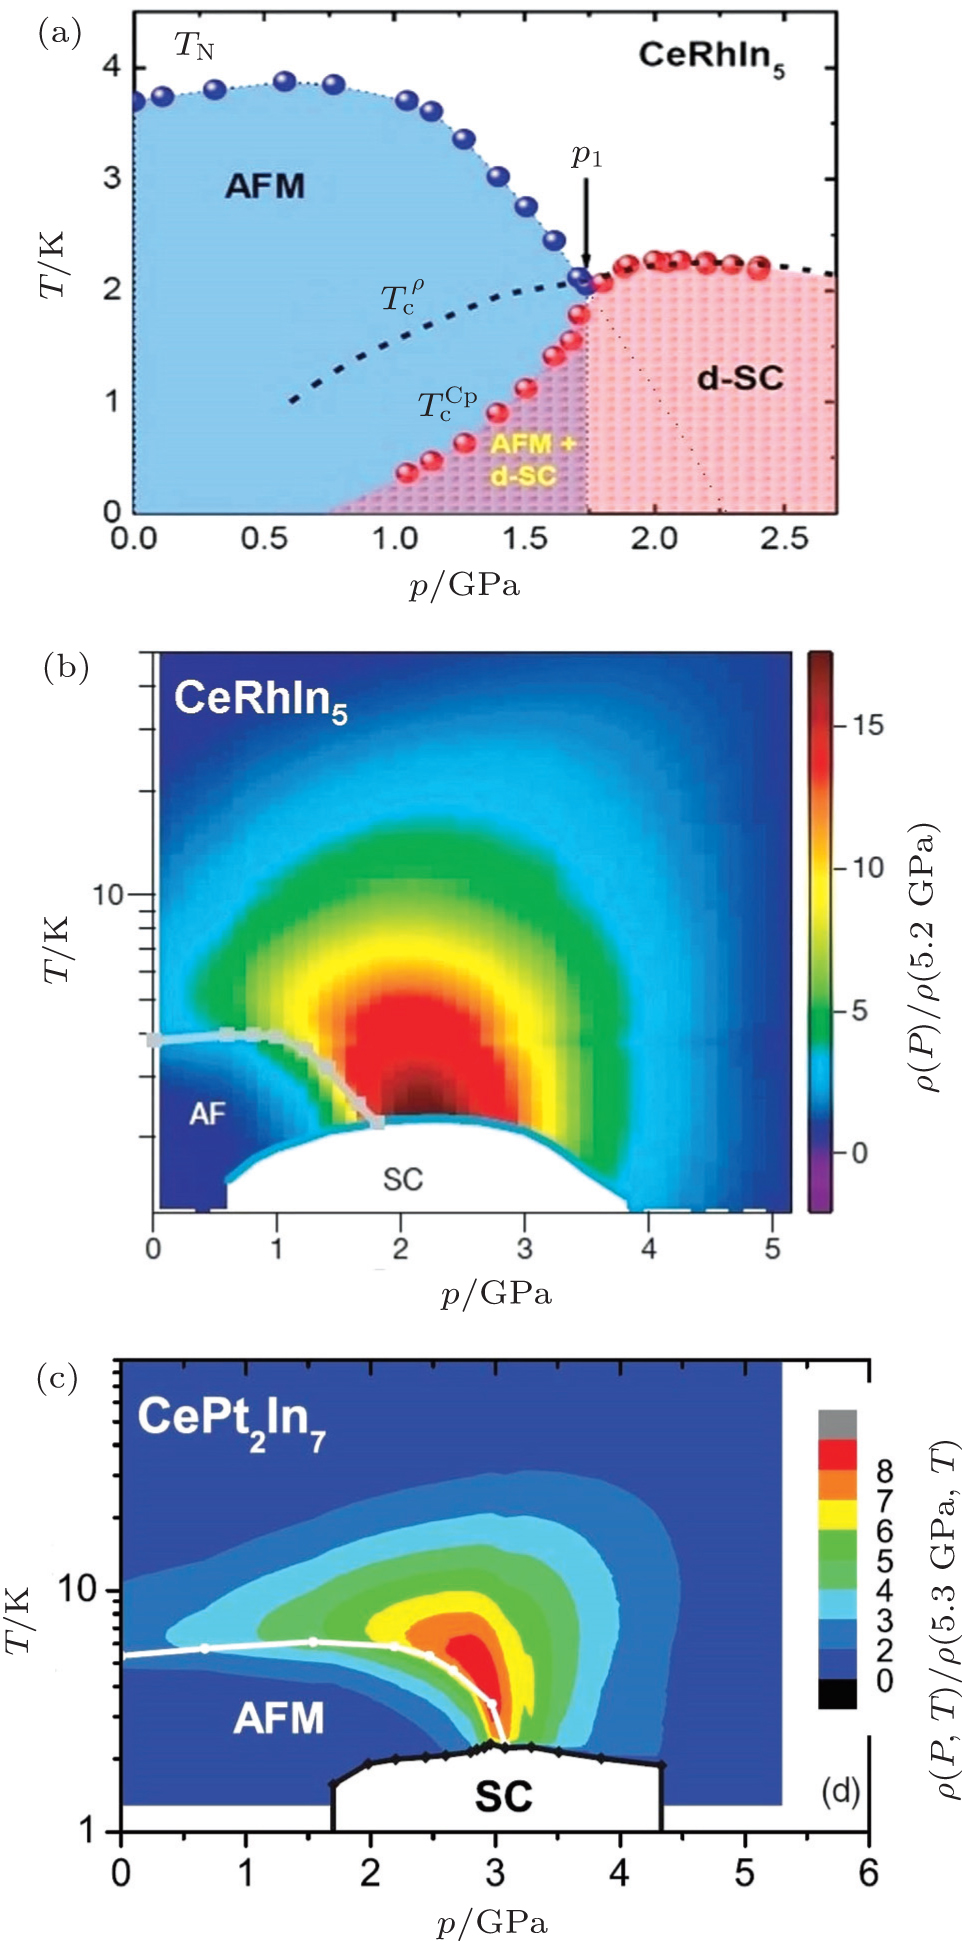
(a) Pressure–temperature phase diagram of CeRhIn5, where the blue symbols represent the Néel temperature TN and the red represents the bulk superconducting transition temperature , which merges with the dashed line representing the resistive superconducting transition temperature at p1 = 1.75 GPa (adapted from Ref. [45]). (b) Contour color plot for the normalized residual resistivity of CeRhIn5 as a function of temperature and pressure (adapted from Ref. [48]). (c) Contour color plot for the normalized residual resistivity of CePt2In7 as a function of temperature and pressure (adapted from Ref. [55]). |
 , Yuan Huiqiu‡,