Anisotropic transport properties in the phase-separated La0.67Ca0.33MnO3/NdGaO3 (001) films
Zhang Hong-Rui1, Liu Yuan-Bo1, Wang Shuan-Hu2, Hong De-Shun1, Wu Wen-Bin3, Sun Ji-Rong1, †,
Beijing National Laboratory for Condensed Matter Physics and Institute of Physics, Chinese Academy of Sciences, Beijing 100190, China
Shanxi Key Laboratory of Condensed Matter Structures and Properties, School of Science, Northwestern Polytechnical University, Xi’an 710072, China
Hefei National Laboratory for Physical Sciences at Microscale, University of Science and Technology of China and High Magnetic Field Laboratory, Chinese Academy of Sciences, Hefei 230026, China


† Corresponding author. E-mail: jrsun@iphy.ac.cn

Project supported by the National Basic Research Program of China (Grant Nos. 2011CB921801, 2012CB921403, and 2013CB921701) and the National Natural Science Foundation of China (Grant Nos. 11074285, 51372064, and 11134007).

Abstract
Abstract

The anisotropic transport property was investigated in a phase separation La0.67Ca0.33MnO3 (LCMO) film grown on (001)-oriented NdGaO3 (NGO) substrate. It was found that the resistivity along the b-axis is much higher than that along the a-axis. Two resistivity peaks were observed in the temperature dependent measurement along the b-axis, one located at 91 K and the other centered at 165 K. Moreover, we also studied the response of the resistivities along the two axes to various electric currents, magnetic fields, and light illuminations. The resistivities along the two axes are sensitive to the magnetic field. However, the electric current and light illumination can influence the resistivity along the b-axis obviously, but have little effect on the resistivity along the a-axis. Based on these results, we believe that an anisotropic-strain-controlled MnO6 octahedra shear-mode deformation may provide a mechanism of conduction filaments paths along the a-axis, which leads to the anisotropic transport property.

1. Introduction

Doped manganites with the formula R1−xAxMnO3 (R = rare earth element, A = alkaline earth element) exhibit a wide variety of magneto-transport phenomena due to the strong electronic correlation.[13] The strongly coupled charge, spin, orbital, and lattice degrees of freedom lead to states with competing energies. As a consequence, even subtle stimuli such as electric/magnetic fields,[48] light irradiation,[9,10] heat, and lattice strains[11] can result in a switching of the manganites between different states, bringing about various peculiar properties, such as colossal magnetoresistance (CMR), colossal electro-resistance (CER), and insulator–metal transition. Among these, the effect of the lattice strain deserves special attention. Many studies confirmed that the lattice strain in manganites is crucially important since it may trigger a phase separation, and then tailor the magnetic and transport properties.[12] As observed by Li et al. in the La2/3Ca1/3MnO3 films grown on (110)-SrTiO3 and LaAlO3 substrates, the anisotropic lattice strain imposed by the substrate affects the magnetic anisotropy of the films. Strain induced anisotropic magnetic and transport properties have also been reported by Shen et al.[13] The authors found that the anisotropic strains favor a distinct arrangement of the metallic phase in the La5/8−xPrxCa3/8MnO3 (x = 0.3) film, leading to a preferential percolation along a certain axis. Wu et al.[14] found that annealing the La0.67Ca0.33MnO3 films grown on NdGaO3 substrates in oxygen atmosphere can lead to the formation of an antiferromagnetic insulator (AFI) phase. Particularly, the ferromagnetic-metal (FM) phase has a preferred growth direction in the AFI background.[15,16] This is in sharp contrast to the ordinary phase-separated manganites, and gives us an opportunity to study the anisotropic transport properties in manganites.

Up to now, there are many reports on the anisotropic properties in manganites,[17,18] but none of those works focused on tuning the anisotropic of the magnetic and transport properties using external stimuli of magnetic field, electric current, and light irradiation. On the other hand, the mechanisms based on strain and chemical disorder are inadequate to interpret the phenomenon. Therefore, we choose the phase-separated La0.67Ca0.33MnO3/NdGaO3 (001) thin film as our research object. In this paper, we present a systematic investigation on the anisotropic properties of the (001)-oriented La0.67Ca0.33MnO3/NdGaO3 thin film under the magnetic field, electric current, and light irradiation. The result shows that the resistivity along the b-axis is much higher than that along the a-axis and two resistivity peaks are observed along the b-axis, one at 91 K and the other centered at 165 K. Effects of the magnetic field, electric current, and light illumination on the resistivities along the two axes are further found to be different: both resistivities along the two axes are sensitive to the magnetic field but the resistivity along the b-axis is more susceptible to the electric current and light illumination, becoming more conducting.

2. Experiments

A 24-nm-thick La0.67Ca0.33MnO3 film was grown on the (001)-NdGaO3 substrate by the pulsed laser ablation technique at the laser energy of ∼2 J/cm2 and the repetition rate of 5 Hz. There exists an obvious anisotropy in the (001)-NdGaO3 substrate, whose lattice constants are a = 3.840 Å, b = 3.889 Å, and c = 3.855 Å. The lattice mismatch can be calculated. There are 0.85% tensile strain along the b-axis and −0.70% compressive strain along the a-axis. During the growth, the temperature of the substrate was kept at ∼735 °C and the oxygen pressure was maintained at ∼45 Pa. The film was then ex-situ annealed at 780 °C in flowing O2 for 12 h to be in the antiferromagnetic-insulation phase. The standard four-probe technique was adopted for the resistive measurements, using a Keithley 2400 sourcemeter and a Keithley 2182 nanovoltmeter. Magnetic measurements were performed in a Quantum Design superconducting quantum interference device (SQUID) magnetometer with the magnetic field applied parallel to the b-axis. The photo-conductance was measured in a close cycling cryogenic system equipped with a window for incident light. The size of the laser spot is ∼1 mm2, completely covering the gap between the probes.

3. Results and discussion

Figure 1 shows the temperature-dependent resistivities along the a-axis and b-axis for the La0.67Ca0.33MnO3 epitaxial film grown on NGO (001) substrate. One can notice that the sample experiences complex phase transitions along the two directions: the transition from paramagnetic insulator (PI) to ferromagnetic metal (FM) occurs at TC of 255 K; the AFI phase first appears at 245 K (TAFI); the insulator–metal transition (IMT) occurs below 200 K. Moreover, we discover the anisotropic resistivities along the a-axis and b-axis. In comparison to the resistivity along the a-axis, the resistivity along the b-axis is much higher in the whole temperature range and the insulator–metal transition temperature shifts to the lower temperature during the cooling process along the b-axis. In particular, two peaks (labeled by green arrows 1 and 2 in Fig. 1) appear along the b-axis during the warming process, one located at 91 K and the other at about 165 K, which is close to the unique peak along the a-axis in the heating process, and also the resistivity situated at 165 K is less than the peak value located at 91 K. A similar result is also observed in Pr0.63Ca0.37MnO3 and La0.7Ca0.3MnO3−δ films, which show two resistivity peaks under an applied magnetic field of 5 T.[19,20] It is believed that there are two phase transitions in the process. For our La0.67Ca0.33MnO3/NGO films, the specific mechanism will be further discussed latter. In addition, the coexisted FM and AFI phases always compete with each other, which also leads to a complex thermal hysteresis below 245 K.

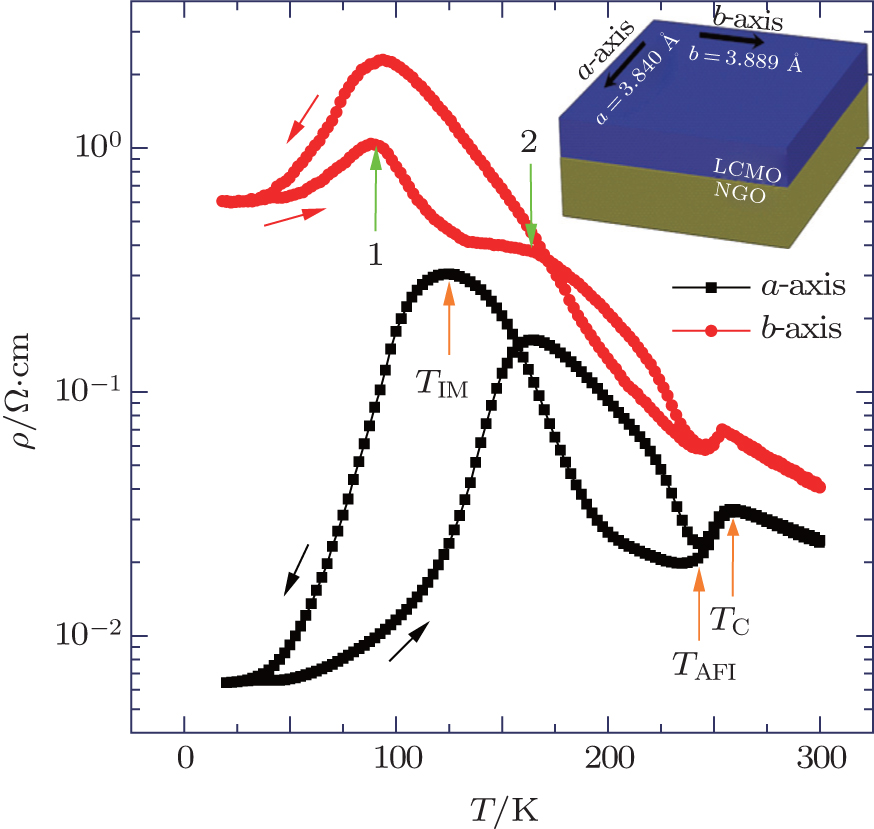
Fig. 1. Temperature dependence of the resistivity in La0.67Ca0.33MnO3/NdGaO3 (001) film measured along the a-axis and b-axis respectively. Two peaks are marked by 1 and 2.

We have already known that the sample possesses anisotropic resistivities along the a-axis and b-axis. It is an interesting question whether the external stimuli, such as the measuring electric current, magnetic field, and light illumination, produce different effects on the resistivities along the two directions. Firstly, we focus on the influence of the electric current on the resistivities along the two axes. Figures 2(a) and 2(b) show the resistivity as a function of temperature measured under a series of electric currents along the a-axis and b-axis. As shown in Fig. 2(a), along the a-axis, the changes of the resistivity and the peak position are quite trivial even under the current density of 24 μA/mm2, while there is a distinct effect on the resistivity along the b-axis, as displayed in Fig. 2(b). With the increase of the measuring current density, the resistivity below 200 K decreases significantly, and the peak position of the resistivity begins to shift towards a higher temperature dramatically during the process of temperature decreasing and increasing, similar to the observations under the effect of a magnetic field. Furthermore, the peak centered at 91 K nearly disappears under the action of a large electric current density in the heating process. To further illustrate the electric current effect, we define the electroresistance as ER = 1 − ρ (J)/ρ (0.3 μA/mm2), where ρ(J) is the resistivity when the testing current density is J. When the current density reaches 24 μA/mm2, it causes an ER as high as 82% at 91 K. We can infer that an even larger value of ER can be obtained by increasing the measuring current density. Consequently, we draw a conclusion that the sample has a noticeable anisotropic transport property and the resistivity along the b-axis is more susceptible to the electric current, in contrast to that along the a-axis. This is the first observation for the electric current-induced anisotropic resistivity change in the phase-separated La0.67Ca0.33MnO3/NdGaO3 (001) film.

Fig. 2. Resistivity versus temperature along (a) a-axis and (b) b-axis under various electric current densities.

In Fig. 2, the pronounced current effect along the b-axis is observed. Considering that the memory effect may occur at low temperatures in manganites, we wonder whether our film retains the lower resistivity in the heating process after the film undergoes the processing with large current density during cooling. To answer this question, we first processed the film by large current density during the cooling process, and then measured the resistivity with the current density of 0.3 μA/mm2 during heating. As demonstrated in Fig. 3, we find that the resistivity raises partially when the measuring current density reduces from the large one to 0.3 μA/mm2 at 20 K. This phenomenon has also been observed in the La5/8−yPryCa3/8MnO3 (y = 0.43) thin film.[21] As the temperature goes up, the film can keep the intermediate value of the resistivity in the main till about 70 K followed by a sharp jump in the resistivity. Subsequently, above 120 K, the resistivity coincides with that of the film processed by 0.3 μA/mm2. It is believed that the large current density induced memory effect varies non-monotonically with temperature, which differs from our prior results in the phase separated La5/8−yPryCa3/8MnO3 (y = 0.43) film.

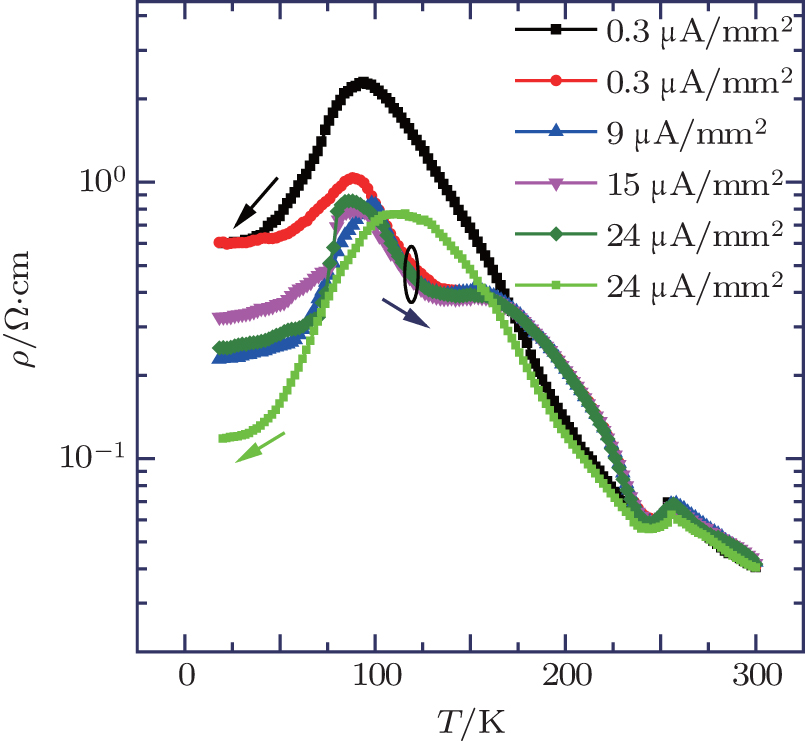
Fig. 3. Resistivity as a function of temperature measured along the b-axis. The resistivity of the film was first measured with a certain large electric current density during the cooling process and then the resistivity was recorded with the current density of 0.3 μA/mm2 during the warming process. The measurement current densities and cooling/warming process are given in the graph.

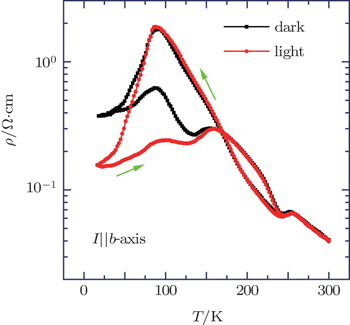
Next we try to study the effect of light illumination on the resistivities along the two axes. To explore the influence, we carried out the following measurement. The sample was mounted in a continuous-flow type cryostat. Then the laser was introduced to the gap between the electrodes. The laser spot fully covered the gap. We measured the resistivity as a function of temperature under the light illumination with power densities of 0 (dark) and 100 mW along the b-axis. The results are presented in Fig. 4. It is shown that the light illumination makes the resistivity fall below 70 K during the cooling process. In the subsequent heating test, the resistivity displays the lower value until 170 K. We notice that the illumination weakens the intensity of the resistivity peak located at 91 K during heating, suggesting that the light illumination can regulate this state at 91 K, but has little effect on the state at 168 K. We also perform the same study along the a-axis (the data is not shown), which indicates that the light illumination does not influence the resistivity along the a-axis at all.

Fig. 4. Temperature dependence of the resistivity along the b-axis under light illumination with power densities of 0 (dark) and 100 mW.

In addition to the electric current and the light illumination, it is meaningful to recognize the influence of the magnetic field on the resistivities along the two axes. Figure 5(a) depicts the temperature dependence of resistivity performed in different magnetic fields along the a-axis. It is shown that the resistivity below TC drops remarkably and the peak position of the resistivity moves to the higher value when the magnetic field increases to 0.25 T. With the further increase of the magnetic field, the resistivity peak and the temperature loop between the cooling and warming processes which come from the competition between AFI phase and FM phase nearly vanish, and TIM also shifts towards the high temperature. This suggests that the AFI phase in the film almost all transforms into the FM phase under the action of the magnetic field. The resistivity as a function of temperature along the b-axis under a series of magnetic fields is also analyzed, as shown in Fig. 5(b). In the same way, the resistivity declines gradually as the magnetic field increases. However, different from the change along the a-axis, especially in the warming process, the peak value centered at 91 K becomes smaller and the peak position moves to the higher temperature when the magnetic field increases from 0 T to 7 T. It is a great surprise to find that the peak located at 91 K does not disappear, even the applied magnetic field reaches up to 7 T. Nevertheless, for the resistivity peak centered at 165 K, the peak position changes from 162 K at 0 T to 220 K at 0.25 T, then no resistivity peak is observed when the magnetic field increases to merely 1 T. The change of the resistivity along the b-axis under the magnetic field shows that the mixed phases located at about 91 K are robust which can hold the AFI state in part until 7 T, implying that the mixed phases are an AFI dominated state. The mixed phase at 165 K is more sensitive to the magnetic field, suggesting that this mixed phase is an FM dominated state. In a word, different influences of the magnetic field on the resistivities along the two axes are observed. Consequently, the results demonstrate that the electric current and the light illumination have the same effect on the resistivity, and they largely affect the state located at 91 K along the b-axis. While, the magnetic field easily alters the resistivity peak at 168 K along the two directions.

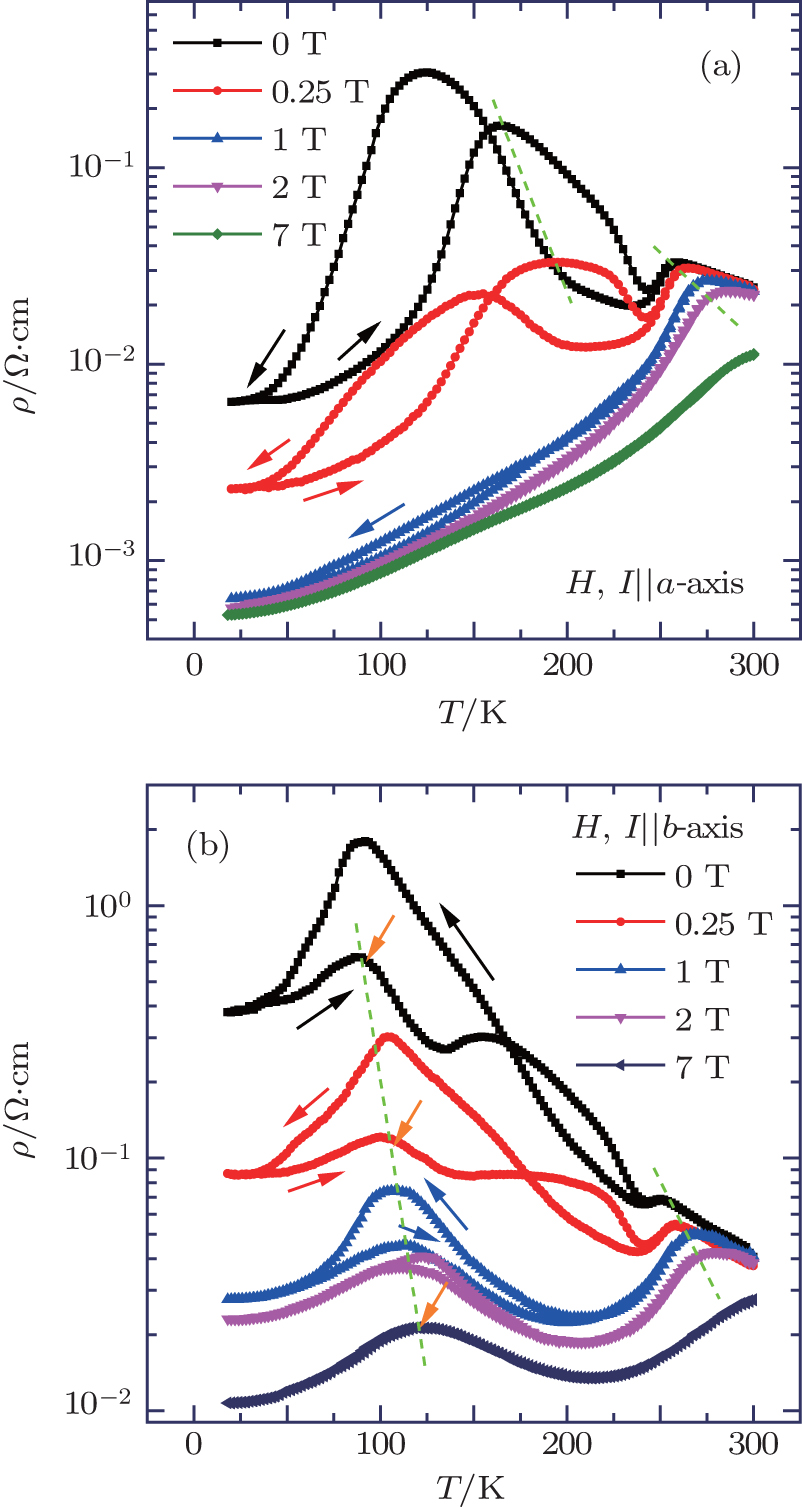
Fig. 5. Resistivity versus temperature along (a) a-axis and (b) b-axis under various magnetic fields.

Our La0.67Ca0.33MnO3/NdGaO3 (001) thin film is a typical phase separation system in low temperature,[22] in which competing FM and AFI phases interplay. The FM and AFI domains do not distribute randomly, since the resistivity along the a-axis is far lower than that along the b-axis, suggesting that the conductive FM phase may arrange along the a-axis. This speculation is reasonable, since there exists an obvious anisotropy in the (001)-NdGaO3 substrate. The LCMO/NGO (001) films suffer from a −0.70% compressive strain along the a-axis but a 0.85% tensile strain along the b-axis. Wu et al. also inferred a similar structure. Due to the anisotropic strain from the NGO substrate, the MnO6 octahedrons of the manganites may produce shear-mode deformations, which arrange the AFI and FM phases into an orientation-preferred pattern, thus resulting in the anisotropic percolative transport.

Based on the above results, we speculate that the FM and AFI domains arrange like stripes along the a-axis, as shown in the inset of Fig. 6. In that case, because the resistivity of the FM domains is smaller, and the electrons of the film travel along the path of least resistance between the contacts, the resistivity measured along the a-axis actually reflects the resistivity of the FM domains. The transport path will not be forced to cross the insulating regions when there are available metallic regions. However, when we measure the resistivity along the b-axis, the electric current must travel across the FM and AFI domains. The AFI and FM domains together determine the total resistivity. Therefore, we can consider that the FM domains are connected in parallel with the AFI domains along the a-axis, while the FM domains are in series with the AFI domains along the b-axis. In Fig. 1, there is only one resistivity peak centered at 165 K along the a-axis. Combined with the above analysis, we believe that the peak centered at 165 K corresponds to the state in which the FM phase is dominant along the a-axis. On the other hand, along the b-axis, the FM domains are in series with the AFI domains. For series resistors, the one with a higher resistance plays a leading role in all-in resistance, and the resistivity of the AFI phase is much higher than that of the FM phase. As observed in Fig. 1, the peak at 91 K appears along the b-axis during the warming process, suggesting that the peak at 91 K may reflect the property of the AFI phase dominated state.

Fig. 6. ZFC and FC (7 T) magnetization–magnetic field loops of the LCMO/NGO film measured at 23 K. The inset shows the sketches for the phase distribution in the LCMO/NGO film.

In recent years, many groups found that colossal electroresistance could be achieved without increasing the metallic composition in a phase separation system.[23] It is reported that the formation of a filamentary conducting path along a certain direction can account for this phenomenon. For another, Tokura et al. reported that the light-induced insulator–metal transition is due to the emergence of a well-localized conducting path in the Pr0.7Ca0.3MnO3 single crystal.[10] According to the results in Figs. 2 and 4, the electric current and light illumination can make the resistivity at low temperature drop substantially, even bring the resistivity peak at 91 K disappear along the b-axis. However, the resistivity peak at 165 K has little change under the electric current and light illumination along the a-axis. It suggests that a filamentary percolation path is established along the b-axis more easily when the film is processed by the electric current or light illumination. It is because many paths have already existed along the a-axis, the electric current travels along the FM domains rather than producing new filamentary paths when the electric current or light illumination is exerted on the film. As a result, the electric current and light illumination alter the resistivity along the b-axis more easily. What is more, the electric current induced resistivity drop possesses an evident memory effect, as shown in Fig. 3. Although the formed filamentary paths may be unstable since the resistivity rebounds after the removal of the large current, most of the effect is memorized. However, the memory effect of the film can be destroyed by increasing temperature. Additionally, when the sample is processed by the magnetic field (shown in Fig. 5), the AFI phase may be converted into the FM phase. More filamentary percolation paths are formed along the a-axis, leading to the dramatic decline of the resistivity along the a-axis. On the contrary, a small part of the AFI phase still exists even under the magnetic field of 7 T, and the resistivity peak at 91 K corresponds to the AFI dominated mixed phases. Hence, the residual AFI phase will render the resistivity peak at 91 K hold even at 7 T.

At last, we investigate the magnetic properties in the phase separation LCMO/NGO film. We performed a series of zero field cooling (ZFC) and field cooling (FC-7 T) magnetization–magnetic field loop measurements at different temperatures along the b-axis. Figure 6 present ZFC and FC magnetization–magnetic field loops at a representative temperature of −23 K. As observed from Fig. 6, the FC MH displays an obvious squared loop with the saturated magnetization (MS) of 2.9 μB/Mn and the coercive field of 0.0249 T. In contrast, for the ZFC MH, the smaller saturated magnetization (MS) of 1.09 μB/Mn and higher coercive field of 0.0464 T are observed. This phenomenon is understandable since the magnetic field can tune the fraction of the AFI and FM phases. When the sample is field-cooled under 7 T to a certain temperature, the magnetic field has converted the AFI phase into the FM phase. The magnetic result also indicates that the magnetic field can make the AFI phase transform into the FM phase.

4. Summary

We have investigated the anisotropic transport property in a phase separation LCMO film grown on (001)-oriented NGO substrate. The results show that the resistivity along the b-axis is much higher than that along the a-axis and two resistivity peaks are observed along the b-axis: one located at 91 K and the other centered at 165 K. Moreover, we also studied the response of the resistivities along the a-axis and b-axis to various electric currents, magnetic fields, and irradiations. The magnetic field can alter the resistivities along the two axes. However, the electric currents and light illuminations mainly influence the resistivity along the b-axis, but have little effect on the resistivity along the a-axis. According to the results, we believe that an anisotropic-strain-controlled MnO6 octahedra shear-mode deformation may provide a mechanism of conduction filaments paths along the a-axis, which leads to the anisotropic transport properties.

Reference
1Shenoy V BSarma D DRao C N R2006Chem. Phys. Chem72053
2Cox SSingleton JMcDonald R DMigliori ALittlewood P B 2008 Nat. Mater. 7 25
3Dagotto EHotta TMoreo A 2001 Phys. Rep. 344 1
4Zhao Y GWang Y HZhang G MZhang BZhang X PYang C XLang P LZhu M HGuan P C2004Appl. Phys. Lett.86122502
5Hu F XGao J 2004 Phys. Rev. 69 212413
6Asamitsu ATomioka YKuwahara HTokura Y 1997 Nature 388 50
7Yoshizawa HKawano HTomioka YTokura Y 1995 Phys. Rev. 52 R13145
8Uehara MMori SChen C HCheong S W 1999 Nature 399 560
9Sheng Z GSun Y PDai J MZhu X BSong W H 2006 Appl. Phys. Lett. 89 082503
10Fiebig MMiyano KTomioka YTokura Y 1998 Science 280 1925
11Hwang H YPalstra T T MCheong S WBatlogg B 1995 Phys. Rev. 52 15046
12Zayak A THuang XNeaton J BRabe K M 2008 Phys. Rev. 77 214410
13Ward T ZBudai J DGai ZTischler J ZYin LShen J 2009 Nat. Phys. 5 885
14Huang ZWang L FChen P FGao G YTan X LZhi B WXuan X FWu W B 2012 Phys. Rev. 86 014410
15Wang L FTan X LChen P FZhi B WSun Z GHuang ZGao G YWu W B 2013 Appl. Phys. Lett. 103 072407
16Huang ZWang LTan XChen PGao GWu W 2010 J. Appl. Phys. 108 083912
17Amaral V SLourenco A A C SAraújo J PTavares P BAlves ESousa J BVieirad J MSilva M F daSoares J C2000J. Magn. Magn. Mater.2111
18Chen X GYang J BYang Y BWang C SLiu S QZhang YHan J ZYang Y C 2014 J. Appl. Phys. 115 043904
19Hardy VWahl AMartin C 2001 Phys. Rev. 64 064402
20Prokhorov V GKomashko V ASvetchnikov V LLee Y PPark J S 2004 Phys. Rev. 69 014403
21Liu Y BSun J RShen B G 2013 J. Appl. Phys. 114 193704
22Wang L FHuang ZTan X LChen P FZhi B WLi G MWu W B 2010 Appl. Phys. Lett. 97 242507
23Garbarino GAcha CLevy PKoo T YCheong S W 2006 Phys. Rev. 74 100401