Ye Lin-Mao 1, Wu Zhen-Wei 1, 2, Liu Kai-Xin 1, 2, †,  , Tang Xiu-Zhang 3, Xiong Xiang-Ming 1 |
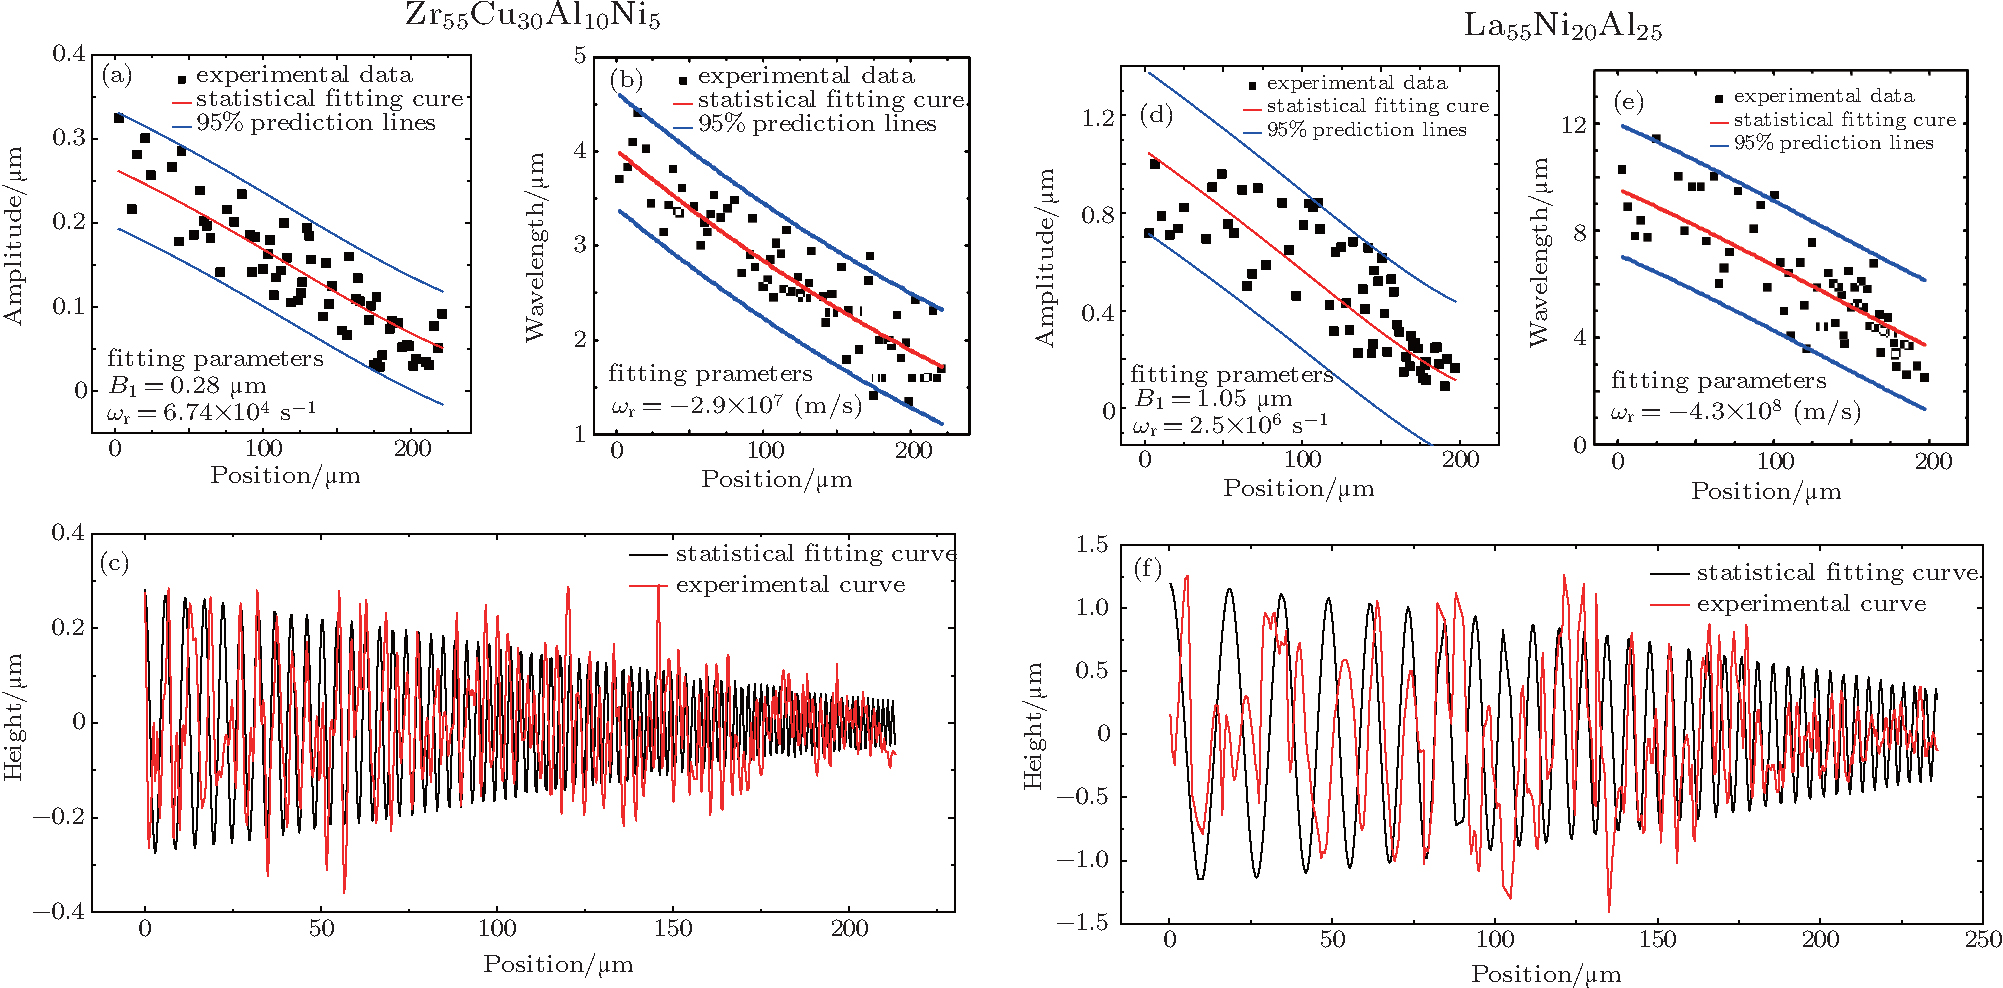
Experimental data and the theoretical statistical data along the x direction of the wave such as the red exemplificative lines shown in Figs. 2(a) and 2(c). Panels (a) and (d) show the position-dependent amplitudes, panels (b) and (e) the position-dependent wavelengths, and panels (c) and (f) are the position-dependent entire cures. Panels (a), (b), and (c) refer to the results of Zr55Cu30Al10Ni5, and panels (d), (e), and (f) show the results of La55Ni20Al25. In panels (a), (b), (d), and (e), the grid points are the experimental statistical data, the red line is the theoretical fitting curve, and the fitting parameters are given. The blue lines are the 95% prediction lines, which means that the probability for true values of the experimental data falling into the intervals is 95%. Panels 3(c) and 3(f) show the comparison between whole waves, i.e. between the statistical fitting curve (black) drawn from Eq. (10) and the experimental curve (red). |