


Pressure effect on magnetic phase transition and spin-glass-like behavior of GdCo2B2
[Hu Guang-Hui1, †,  , Li Ling-Wei2, Izuru Umehara1]
, Li Ling-Wei2, Izuru Umehara1]
|
|


† Corresponding author. E-mail:
Project supported by JSPS KAKENHI (Grant No. 24540366, Grant-in-Aid for Scientific Research (C)).
We systematically investigate the effect of pressure on the magnetic properties of GdCo2B2 on the basis of alternating current (AC) susceptibility, AC heat capacity and electrical resistivity measurements under pressures up to 2.2 GPa. A detailed magnetic phase diagram under pressure is determined. GdCo2B2 exhibits three anomalies that apparently reflect magnetic phase transitions, respectively, at temperatures TC = 20.5 K, T1 = 18.0 K and TN = 11.5 K under ambient pressure. Under pressures up to 2.2 GPa, these anomalies are observed to slightly increase at TC and T1, and they coincide with each other above 1.6 GPa. Conversely, they decrease at TN and disappear under pressures higher than 1.4 GPa. The results indicate that the low-temperature magnetic phases can be easily suppressed by pressure. Moreover, the spin-glass-like behavior of GdCo2B2 is examined in terms of magnetization, aging effect and frequency dependence of AC susceptibility. A separation between the zero-field-cooled (ZFC) and field-cooled (FC) magnetization curves becomes evident at a low magnetic field of 0.001 T. A long-time relaxation behavior is observed at 4 K. The freezing temperature Tf increases with frequency increasing.
The intermetallic compound GdCo2B2 was first reported by Niihara et al. in 1973; it has a body-centered tetragonal crystalline structure (space group I4/mmm) and its lattice parameters are a = 3.573 ± 0.003 Å and c = 9.540 ± 0.005 Å.[1] Felner reported that GdCo2B2 is a ferromagnetic material below the Curie temperature TC = 26 K in a magnetic field of 0.1 T.[2] Magnetic susceptibility measurements in a high-temperature region up to 800 K showed that Co in this compound has no magnetic moment.[3] In 2009, Li et al. proposed that this material be ordered antiferromagnetically under the Néel temperature, TN = 15 K, based on its magnetization in a field of 0.1 T as a function of temperature.[4] Recently, a rather complicated magnetic phase diagram of single-crystal GdCo2B2 has been reported by Pospíšil et al.; this diagram shows four magnetic transitions at temperatures of 22, 18.5, 13, and 7 K, respectively.[5] The conformal complex magnetic phase diagram strongly suggests the existence of complicated magnetic interactions in this material.
High pressure is recognized as one of the most powerful tools for realizing the intrinsic physical properties of materials; as is well known, the magnetic properties of the 4f and 5f electrons in rare-earth and uranium intermetallic compounds are very sensitive to pressure.[6–8] For example, the unconventional superconductivity of 5f electrons in itinerant ferromagnetic UGe2 under high pressure has been extensively studied.[7] Previously, we have reported the DC magnetization and magnetic susceptibility each as a function of temperature in GdCo2B2 under high pressure.[9] By increasing the pressure up to 1.27 GPa, TC increased slightly from 22.2 K to 26.5 K and the antiferromagnetic (AFM) ordering was totally suppressed above 2.0 K.
As pointed out by the authors above, Ruderman–Kittel–Kasuya–Yosida (RKKY) indirect exchange interaction plays an important role in determining the magnetic properties of this material. The effective interatomic 4f magnetic interactions are transferred by the Fermi sea surrounding the conduction electrons. The application of high pressure changes the interatomic distances and can change the alignment of the magnetic moments. High pressure can also change the band structure of the conduction electrons by changing the density of states. By conducting experiments under high pressure, we can apprehend how these changes affect the magnetic ordering temperature of GdCo2B2.
In our previous paper, a remarkable phenomenon was observed: the zero-field-cooled (ZFC) and field-cooled (FC) magnetic susceptibility curves were separated at 9 K below TN, where the FC curve was subjected to a magnetic field of 0.1 T. Pospíšil et al. found the same phenomenon in single crystal GdCo2B2 and they also found that the phenomenon became more obvious in low magnetic fields. It appeared at 8.5 K in a magnetic field of 100 mT and at 13.5 K just below TN at 5 mT along the c axis.[5] The separation phenomenon between the ZFC and FC curves is a common feature of spin glass (SG) with the essential ingredients of frustration and disorder. In GdCo2B2, this phenomenon is unexpected as no geometrical frustration exists given its crystalline symmetry. The SG behavior, however, has been found in some of the rare-earth compound families with body-centered tetragonal ThCr2Si2-type structures. As-grown single crystal URh2Ge2 was reported to be a three-dimensional (3D) Ising-like random-bond SG by Süllow et al. in 1997.[10] The SG behavior disappeared because of annealing effects, implying that atomic disorderings of Rh and Ge are the origin of SG in URh2Ge2.[11] PrAu2Si2 was also found by Hemberger et al. in 1999 to be a canonical SG with a freezing temperature of 3 K.[12] In this compound, a frustration relates to the singlet ground state and the exchange coupling “avoided criticality” to the SG system.[13] SGs have been extensively studied by many researchers since the pioneering work by Cannella and Mydosh in 1972,[14] but still have unquestionable richness in condensed matter physics.
In the present paper, we perform precise measurements of AC susceptibility, AC heat capacity, and electrical resistivity to obtain more information about the phase transitions of GdCo2B2 by controlling the pressure of it. We define a detailed magnetic phase diagram based on these results. Moreover, we shed light on the SG-like behavior, namely, the separation phenomenon at low temperature. It is examined in terms of magnetization, aging effects, and frequency dependence of AC susceptibility measurements in order to clarify the nature of magnetic properties at low temperature. Finally, we discuss the relationship between magnetic phase transitions under pressure and SG-like behavior.
High-quality polycrystalline GdCo2B2 was synthesized from high-purity Gd, Co, and B by an arc-melting method through using a tungsten electrode under an argon atmosphere. The sample was annealed at 1173 K for one week in an evacuated quartz tube. The sample was proved to be of a single phase with a body-centered tetragonal ThCr2Si2-type (space group I4/mmm) structure by an x-ray diffraction (XRD) experiment. Lattice parameters a and c were evaluated to be 3.577 Å and 9.536 Å, respectively. These results were consistent with those previously reported.[1]
The effect of pressure was investigated through AC susceptibility, AC heat capacity, and DC electrical resistivity measurements with a laboratory-made CuBe–NiCrAl hybrid piston cylinder pressure cell.[15] Daphne 7373 oil was used as a pressure-transmitting medium. Heat capacity measurement is known as an excellent method of observing the bulk properties of magnetic phase transitions, and it was performed using a typical Joule heating-type temperature-modulated method.[16,17] When one applies an electrical current with frequency ω to the sample, the Joule heating is supplied at a frequency of 2ω; thus, the temperature of the sample is modulated with a frequency of 2ω. As to the requirements for the experiment, the size of the sample was minimized into a size of 0.2 mm × 0.4 mm × 0.05 mm, a combination of 0.020 mmϕ Au and 0.025 mmϕ AuFe (Fe: 0.07 %) wires was used as a thermocouple to measure the modulated temperature, and a 0.020 mmϕ Au wire was used as a heater. The wires were spot-welded directly onto the sample together with two other Au wires to measure the electrical resistivity. Another piece of the sample was placed inside the compensated pick-up and modulation coils for AC susceptibility measurement with Sn as a manometer. In our laboratory-made system, all measurements could be made under the same pressure conditions.
The SG-like behavior at ambient pressure was examined through a series of experiments. These experiments were performed using a superconducting quantum interference device magnetometer MPMS-7 from Quantum Design, Inc. First, FC and ZFC magnetization each as a function of temperature were determined under various fields. Second, two types of measurements examined the aging effect. The first was of the time-dependence of ZFC magnetization at a selected temperature. The system was cooled from 50 K (much higher than the Curie temperature) to the selected temperature at a rate of 30 mK/s and then maintained at this temperature for 1800 s. Subsequently, the measurement of magnetization as a function of time was undertaken in a magnetic field of 0.01 T. The second experiment was the ZFC measurement with intermittent stops at the selected temperatures. The system was cooled from 50 K to 1.8 K at a rate of 30 mK/s, and the magnetization measurements were performed with intermittent stops of 1800 s at 2, 3, and 4 K in a magnetic field of 0.01 T. AC susceptibility measurements were conducted at four selected frequencies, namely 1, 10, 100, and 1000 Hz, to investigate the behavior of the freezing temperature.
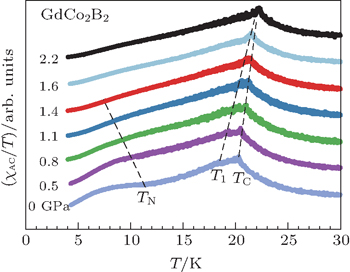
The temperature dependence of the AC susceptibility is shown in Fig.
 | Fig. 1. Temperature dependences of the AC susceptibility under hydrostatic pressure for GdCo2B2. The curves under pressure shifted by the same value in order. The inset shows the temperature-dependent superconducting transition in the AC susceptibility measurement of the manometer Sn under pressure. |
Figure
 | Fig. 2. Temperature dependences of the AC heat capacity under hydrostatic pressure for GdCo2B2. The curves under pressure shift by the same value in order. |
Electrical resistivity ρ versus temperature under pressure is shown in Fig.
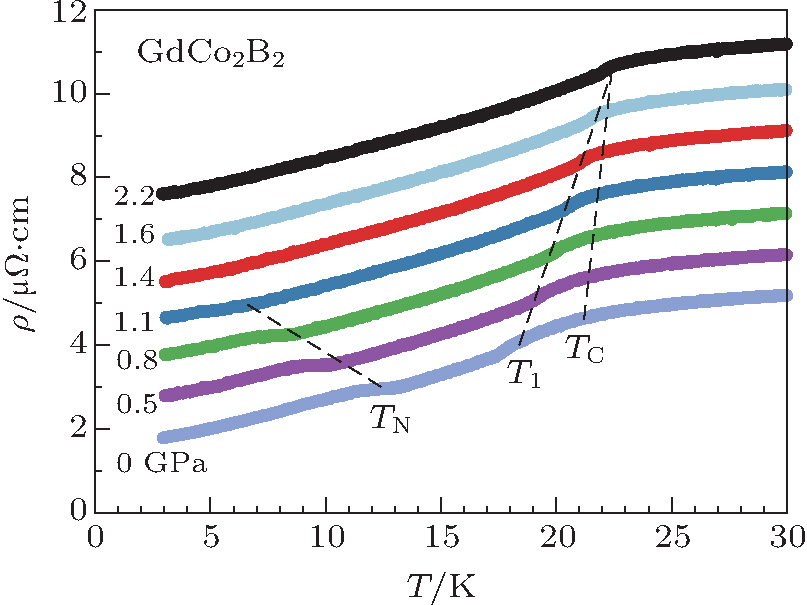 | Fig. 3. Temperature dependences of the electrical resistivity ρ under hydrostatic pressure for GdCo2B2. The data are shifted by an order of 1 μΩ/cm under pressure. |
As is well known, SG behavior has the characteristic separation of the ZFC and FC magnetization curves below a characteristic temperature as a signature. Figure
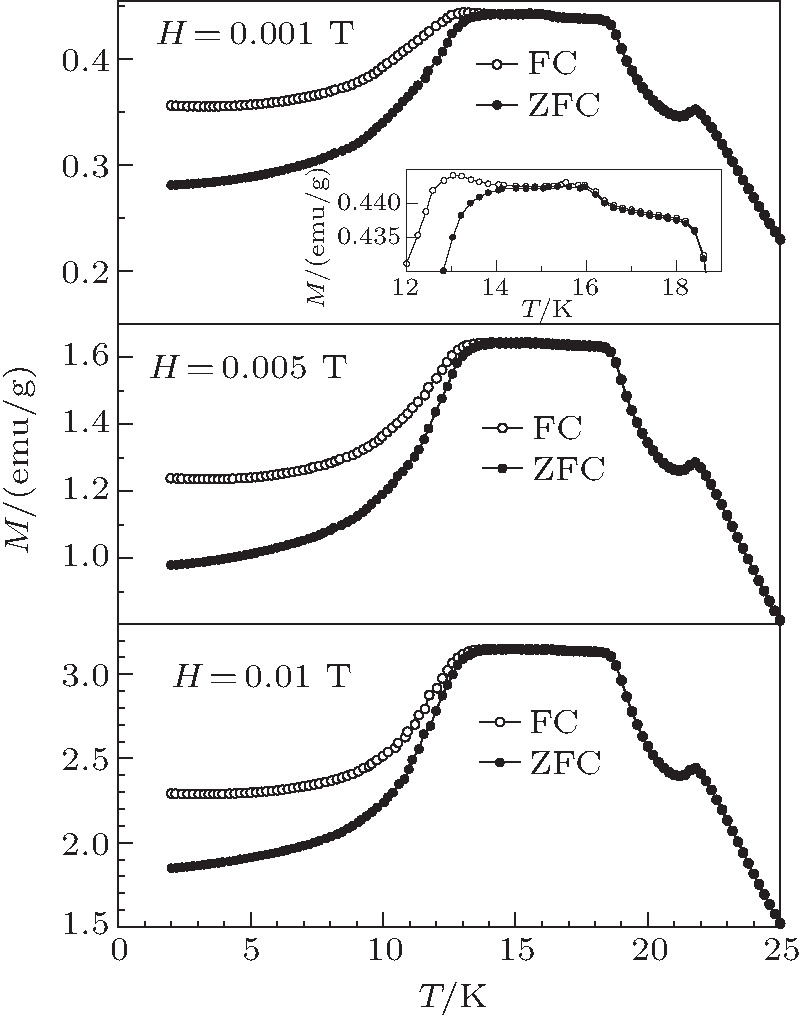 | Fig. 4. Variations of FC and ZFC magnetization with temperature in selected magnetic fields of 0.001, 0.005, and 0.01 T in the temperature range from 2 K to 25 K. |
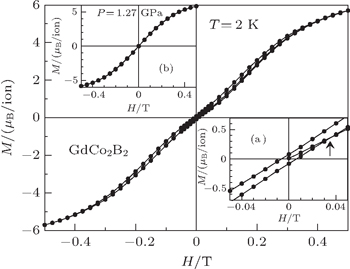
Figure
 | Fig. 5. Hysteresis loop in magnetization measurement as a function of magnetic field at 2 K. Inset (a) displays the hysteresis loop at 2 K in the field range from −0.05 T to 0.05 T. Inset (b) shows the hysteresis loop at 2 K under pressure of 1.27 GPa. |
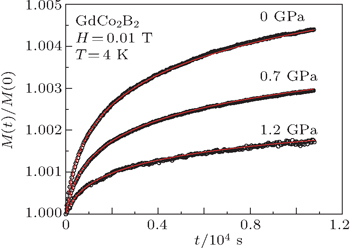
Another crucial feature of the SG behavior is the existence of aging processes on all time scales in the isothermal process. The time dependences of the ZFC magnetization in a magnetic field of 0.01 T are measured as mentioned in Section 2. Figure

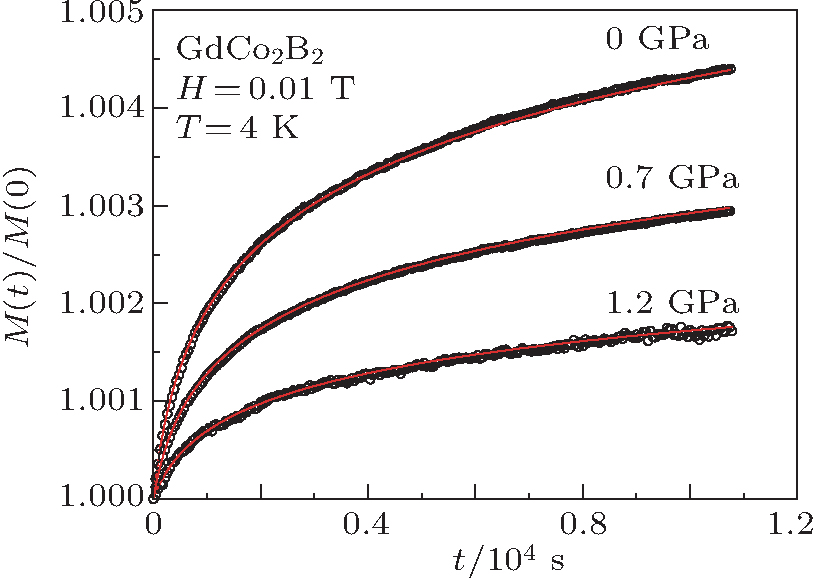 | Fig. 6. Values of magnetization M(t) each as a function of time t, plotted as M(t)/M(0) versus t at 4 K for GdCo2B2 under pressures of 0, 0.7, and 1.2 GPa. The solid lines represent least-squares fits using equation M(t) = M0 + Sln (t/t0 + 1). |
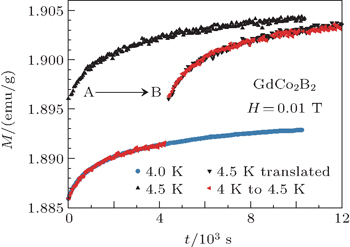
 | Fig. 7. Time dependences of ZFC magnetization with one stop at 4.0 K and 4.5 K, and a two-stops transfer from 4.0 K to 4.5 K with waiting time tw = 4300 s. |
Figure
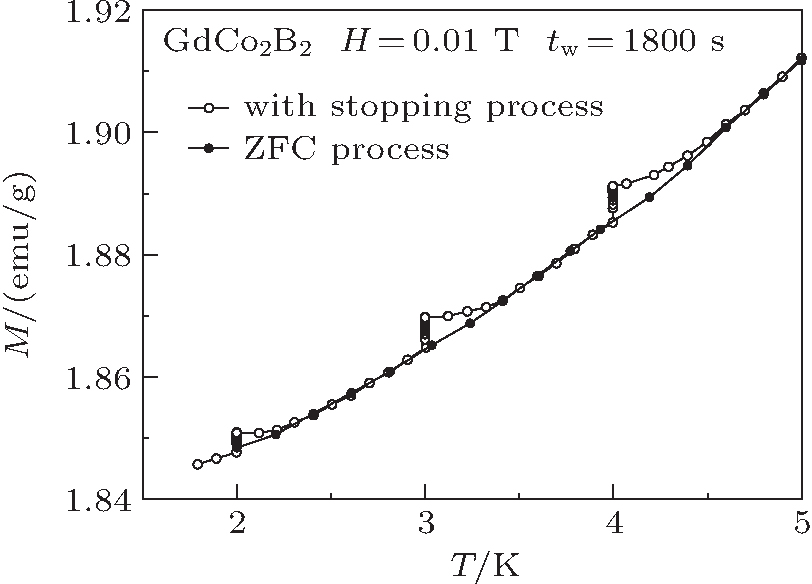 | Fig. 8. Temperature dependence of ZFC magnetization with intermittent stops at 2, 3, and 4 K for 1800 s (empty symbols) and that of a normal ZFC process (solid symbols). |
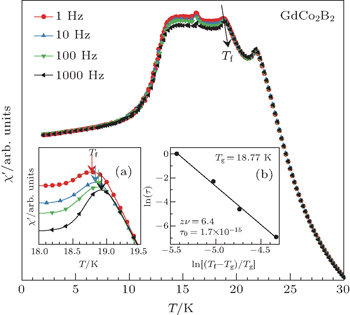
Figure

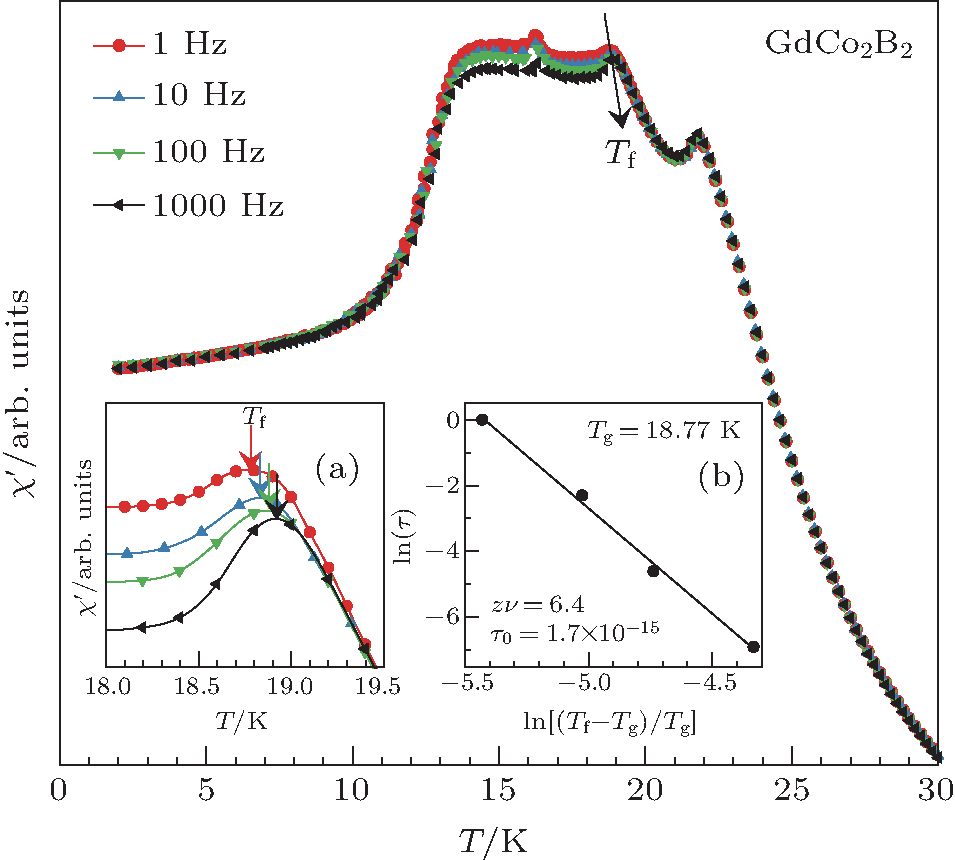 | Fig. 9. Variations of the real (χ′) part of AC susceptibility with temperature for GdCo2B2 at frequencies of 1, 10, 100, and 1000 Hz. Inset (a) shows the detail of freezing temperature Tf. Inset (b) shows ln(τ) as a function of ln[(Tf − Tg)/Tg]. |
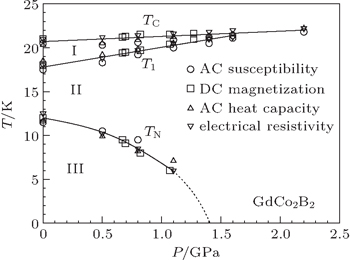
First, the magnetic properties under high pressure are discussed. Figure
 | Fig. 10. The magnetic phase diagram of GdCo2B2 under pressure. □ is from the DC magnetization measurements (see Ref. [9]); ◯ is from the AC susceptibility measurements; △ is from AC heat capacity measurements; and ▽ is from the electrical resistivity measurements. |
Second, we discuss the SG-like behavior of GdCo2B2. The results in Subsection 3.2 prove the existence of SG-like behavior at low temperature and under ambient pressure.
No geometrical frustration exists in GdCo2B2, given its crystalline symmetry. Thus this behavior is unexpected. It is fascinating that the SG-like behavior appears in a non-frustrated system such as GdCo2B2 with the symmetry described by the space group I4/mmm. One possibility is the presence of frustration from the geometric disorders between Co and B atoms as discussed in URh2Si2, but this can be negated since the sample is well annealed. Recently, Motoya et al. observed a long-time variation in the magnetic structure of a non-diluted uniform magnet, CeIr3Si2.[36] Similar behaviors were also studied in intermetallic compounds PrCo2Si2 and TbNi2Si2 by the same authors.[37] The long-time variations in the magnetic structure of these materials were reported to originate from frustrating magnetic interactions.
The splitting of ZFC and FC magnetization curves and the cusp-like behavior in the ZFC magnetization are the features for spin glass or cluster glass system or the coexistence of antiferromagnetism with ferromagnetism.[38–40]
One of the scenarios to understand the SG-like behavior of this compound is the existence of competition between complicated FM and AFM interactions distributed randomly throughout the compound. This can be understood from pervious papers, which claimed the transition at around 11.5 K as Néel ordering.[4,5] We note that SG-like behavior starts at T1 as discussed in Subsection 3.2.1; thus, the AFM interaction starts at T1 and becomes larger from TN.
In this scenario, we discuss the relationship between magnetic phase transitions under pressure and SG-like behavior. The interaction between the localized 4f spins is of RKKY type. In the case of GdCo2B2, Gd3+ ions are responsible for its magnetic orders as mentioned in the Introduction. The FM order is mainly determined by the nearest-neighbor interaction J1 between Gd3+ ions, and the AFM order is mainly determined by the next-nearest-neighbor interactions J2 between the spins of the Gd3+ ions. A small decrease is caused in unit cell size by increasing pressures up to 2.2 GPa. The lattice becomes shorter, which causes the FM interaction (and J1) to be strengthened and the AFM (and J2) weakened. As a result, TC increases while TN decreases and disappears with increasing pressure. The competition between FM and AFM interactions is also weakened in this process. As a response to it, the SG-like behavior of GdCo2B2 is apparently suppressed by pressure. As shown in Fig.
Other scenarios should be considered following our new results, especially, the large magnetization below around 11.5 K (see Fig.
In this stage, we cannot affirm the origin of the SG-like behavior in GdCo2B2, and have not clarified the magnetic structure in GdCo2B2 either. Such a clarification is required to understand both the SG-like behavior of non-geometrical frustrated compound with symmetry described by the space group I4/mmm and the pressure effects on magnetic phases. Unfortunately, it is very difficult to determine the structure by neutron scattering because of the large absorption cross-sections of Gd and B. We are planning to perform x-ray resonant magnetic scattering. It may be interesting to investigate the uniaxial pressure effect for single crystal GdCo2B2, because the weak-but-significant magneto-crystalline anisotropy of as-grown single crystal GdCo2B2 was reported by Pospíšil et al.[5] Further investigations on single crystal GdCo2B2 are expected to provide more information for understanding these interesting properties on this compound.
| 1 | |
| 2 | |
| 3 | |
| 4 | |
| 5 | |
| 6 | |
| 7 | |
| 8 | |
| 9 | |
| 10 | |
| 11 | |
| 12 | |
| 13 | |
| 14 | |
| 15 | |
| 16 | |
| 17 | |
| 18 | |
| 19 | |
| 20 | |
| 21 | |
| 22 | |
| 23 | |
| 24 | |
| 25 | |
| 26 | |
| 27 | |
| 28 | |
| 29 | |
| 30 | |
| 31 | |
| 32 | |
| 33 | |
| 34 | |
| 35 | |
| 36 | |
| 37 | |
| 38 | |
| 39 | |
| 40 | |
| 41 | |
| 42 | |
| 43 | |
| 44 | |
| 45 |