Superconductivity in Sm-doped CaFe2As2 single crystals
Chen Dong-Yun1, Ruan Bin-Bin1, Yu Jia1, Guo Qi1, Wang Xiao-Chuan1, Mu Qing-Ge1, Pan Bo-Jin1, Liu Tong1, Chen Gen-Fu1, 2, Ren Zhi-An1, 2, †,
Institute of Physics and Beijing National Laboratory for Condensed Matter Physics, Chinese Academy of Sciences, Beijing 100190, China
Collaborative Innovation Center of Quantum Matter, Beijing 100190, China


† Corresponding author. E-mail: renzhian@iphy.ac.cn

Project supported by the National Natural Science Foundation of China (Grant No. 11474339), the National Basic Research Program of China (Grant Nos. 2010CB923000 and 2011CBA00100), and the Strategic Priority Research Program of the Chinese Academy of Sciences (Grant No. XDB07020100).

Abstract
Abstract

In this article, the Sm-doping single crystals Ca1 − xSmxFe2As2 (x = 0 ∼ 0.2) were prepared by the CaAs flux method, and followed by a rapid quenching treatment after the high temperature growth. The samples were characterized by structural, resistive, and magnetic measurements. The successful Sm-substitution was revealed by the reduction of the lattice parameter c, due to the smaller ionic radius of Sm3+ than Ca2+. Superconductivity was observed in all samples with onset Tc varying from 27 K to 44 K upon Sm-doping. The coexistence of a collapsed phase transition and the superconducting transition was found for the lower Sm-doping samples. Zero resistivity and substantial superconducting volume fraction only happen in higher Sm-doping crystals with the nominal x > 0.10. The doping dependences of the c-axis length and onset Tc were summarized. The high-Tc observed in these quenched crystals may be attributed to simultaneous tuning of electron carriers doping and strain effect caused by lattice reduction of Sm-substitution.

PACS: 74.70.Xa;74.70.–b;74.72.Ek
1. Introduction

Among the iron-based high-Tc superconductors, the 122-type ternary compounds A/Fe2As2 (A = Ca, Sr, Ba, and Eu) crystallize in the tetragonal ThCr2Si2-type crystal structure at room temperature, and they undergo a spin density wave (SDW) transition around 140 K ∼ 200 K, which is also accompanied by a structural transition from tetragonal to orthorhombic phase at similar temperature.[15] Bulk superconductivity was achieved in these compounds by suppressing the antiferromagnetic SDW ordering via hole or electron doping, even external pressure, etc., and their superconducting Tc is usually below 38 K.[611]

While interestingly, unexpected high-Tc above 40 K was realized in some rare-earth-doped Ca1 − xRxFe2As2 compounds (R = La, Ce, Pr, and Nd), with the highest Tc up to 49 K in Pr-doped CaFe2As2.[1216] This higher Tc phase in electron doped CaFe2As2 is usually filament type with poor superconducting behaviors and highly anisotropic characteristics.[12,13,15,17,18] Some possible reasons were proposed to explain the occurrence of this higher Tc phase, such as crystallographic strain, doping inhomogeneity, and crystal defects, etc.[13,1923] On the other hand, CaFe2As2 is actually special in these 122 compounds, it has the shortest c-axis parameter and the smallest cell volume, which places it near the critical point for a unique collapsed structural phase transition.[9,12,2432] Generally, the pristine tetragonal CaFe2As2 enters into the orthorhombic SDW phase around 170 K, while under a mild external pressure of 0.35 GPa, a collapsed, non-magnetic tetragonal phase would be formed at lower temperature without the formation of SDW phase.[24,25] This collapsed phase can also be stabilized by chemical substitution or furnace quenching processes.[9,12,2630] Moreover, La and P co-doping in CaFe2As2 enhances both the superconducting transition temperature and the shielding volume fraction, which is suggested to be from the simultaneous tuning of the reduction in cell volume and the electron carrier doping.[33] Similar results occur in the La and Ru co-doped CaFe2As2 single crystals.[27] Due to the smaller ionic radius of Sm3+ than Ca2+, the substitution of Sm3+ for Ca2+ may be a suitable method for the structure and carrier modulation in CaFe2As2. While the doping of Sm3+ for Ca2+ is experimentally difficult due to structural instability, and previous study found no clear superconductivity in slightly Sm-doping CaFe2As2 single crystals grown from FeAs flux.[34]

In this article, we report the successful growth of the Sm-doped CaFe2As2 single crystals from CaAs flux. Superconductivity with Tc varying from 27 K to 44 K was observed in these crystals, with a relatively substantial shielding volume fraction obtained in the nominal Ca0.8Sm0.2Fe2As2 single crystal.

2. Experimental details

Single crystals of Ca1 − xSmxFe2As2, with x = 0, 0.01, 0.02, 0.03, 0.05, 0.10, 0.15, 0.20, were grown using the CaAs flux method. A mixture of Ca, Sm, FeAs, and As with a mole ratio of Ca:Sm:FeAs:As = (3 − 3x):3x:2:2 was loaded into an alumina crucible and sealed in an evacuated quartz tube. The ampoules were placed in a muffle furnace and heated at 500 °C and 700 °C for 5 h successively, then slowly heated to 1150 °C for 10 h, maintained at 1150 °C for 30 h and then cooled down to 850 °C slowly at a rate of 1.5 °C/h, followed by quenching in ice-water rapidly. Plate-like single crystals up to 1-mm long were obtained after the flux was removed by washing the products in de-ionized water. The FeAs precursor was pre-sintered by reacting stoichiometric amounts of Fe and As inside an evacuated quartz tube at 750 °C for 30 h.

The obtained plate-like single crystals were characterized by x-ray diffraction (XRD) from 10° to 70° at room temperature, using a PAN-analytical diffractometer with Cu–Kα radiation. The resistive measurements were carried out by employing a standard four-probe method in a quantum design physical property measurement system (PPMS) down to 2 K. The DC magnetic susceptibility was measured using a quantum design magnetic property measurement system (MPMS) with both zero field cooling (ZFC) and field cooling (FC) methods at a magnetic field of 10 Oe (1 Oe = 79.5775 A/m).

3. Results and discussion

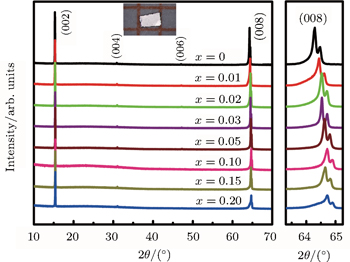
The room temperature XRD patterns for all the single crystals of Ca1 − xSmxFe2As2 samples were presented in Fig. 1 with an enlarged view around (008) reflections placed on the right panel, and an image of a typical plate-like Ca0.85Sm0.15Fe2As2 single crystal was also displayed in the inset. We note that for the Sm-doped CaFe2As2, the crystal growth is difficult, and the crystal size is usually less than 1 mm and much smaller than the undoped crystal. The observation for the (00l) reflections indicates preferential orientation of the single crystals along the c-axis and good crystal quality. As shown from the enlarged view of (008) peaks, we see that the (008) peak moves to higher diffraction angle with the increasing of Sm-doping level when x < 0.10. After x > 0.10 no obvious change of the peak position was observed, which indicates that the real Sm-doping level nearly reaches a maximum when the nominal Sm concentration x > 0.10. The c-axis parameter was calculated and plotted as a function of the nominal Sm concentration x in Fig. 5(a). The reduction of the c-axis parameter with increasing x indicates that Sm is a successful substitution for Ca, since the trivalent Sm3+ (0.96 Å) has a smaller ionic radius than the divalent Ca2+ (0.99 Å). Comparing with other rare-earth doped CaFe2As2, the Sm-doped crystal has much shorter c-axis length,[12] which may cause strong chemical pressure on the Fe–As plane. We note that for the quenched undoped CaFe2As2, the c-axis parameter is much smaller than that of the pristine CaFe2As2 parent compound,[4] and the dramatic c-axis shrinkage is due to the effect of strong internal crystallographic strain induced by the quenching process.[26,35]

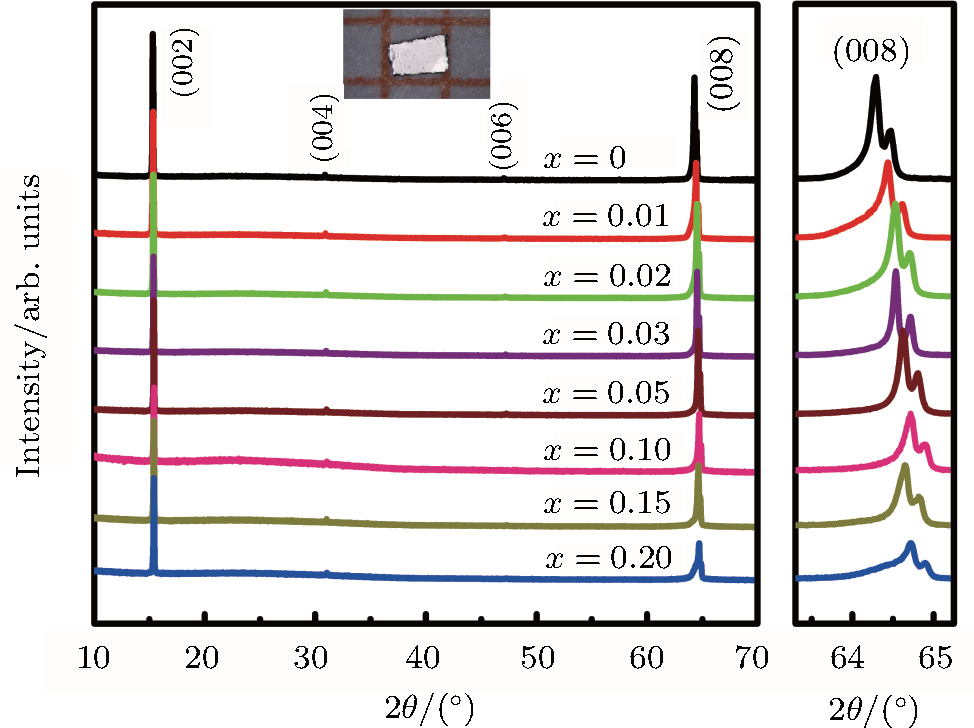
Fig. 1. The room temperature XRD patterns for the Ca1 − xSmxFe2As2 (x = 0 ∼ 0.2) single crystals, with an expanded view near the (008) peaks placed in the right panel. The inset displays an image of a typical plate-like Ca0.85Sm0.15Fe2As2 single crystal.

In Fig. 2 we present the temperature dependence of the normalized in-plane electric resistivity for all of the Ca1 − xSmxFe2As2 single crystals measured between 2 K to 300 K. We observed strain caused superconductivity at 27 K in the undoped quenched CaFe2As2 crystal, which was discussed in another paper.[35] As shown in Fig. 2(a), all the lower doping samples (x < 0.05) display weak superconductivity with the onset Tc increasing monotonically upon Sm doping, from 27 K for undoped samples to 43 K for sample with x = 0.03, and two step superconducting transitions were observed in these crystals. No zero resistivity was found in these lower doping crystals. Besides the superconducting transition, all these lower doping samples show another transition characterized by a resistive drop around 70 K–110 K. The resistivity drop in rare-earth doped or pristine CaFe2As2 single crystal around this temperature range is a typical indication for the collapsed structural phase transition as previously reported.[12,36] This means the existence of filament type superconductivity in the collapsed phase. For higher doping samples with x ≥ 0.05 as displayed in Fig. 2(b), this structural transition induced resistive drop disappears, which should be suppressed by the higher level Sm-doping. This is consistent with the previous report that more electron doping counteracts the chemical pressure which induces the collapsed phase transition.[27] The changing of this collapsed phase transition still needs to be further verified by low temperature structural characterizations. The superconducting transition for these higher doping crystals becomes much sharper, with the onset Tc all close to 44 K. When x ≥ 0.10, the resistive curves become very similar, and zero resistivity was observed around 30 K in these samples. The relationship for onset Tc versus Sm-doping level x was summarized in Fig. 5(b).

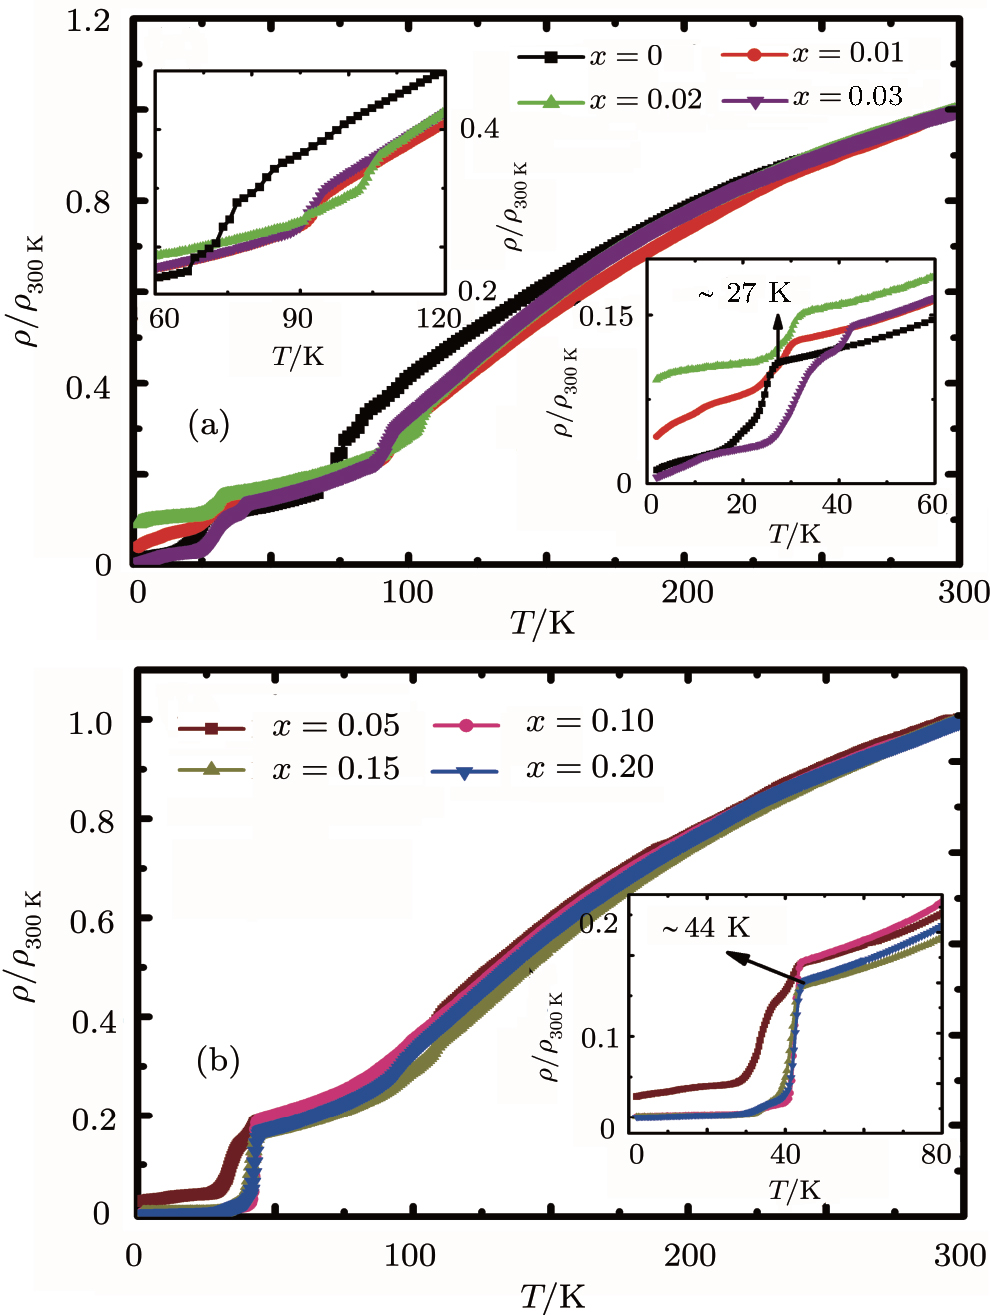
Fig. 2. The temperature dependence of normalized in-plane resistivity for Ca1 − xSmxFe2As2 single crystals of (a) lower doping samples (x = 0.00, 0.01, 0.02, 0.03) and (b) higher doping samples (x = 0.05, 0.10, 0.15, 0.20). The insets show the expanded resistive curves around the collapsed phase transition and the superconducting transition respectively.

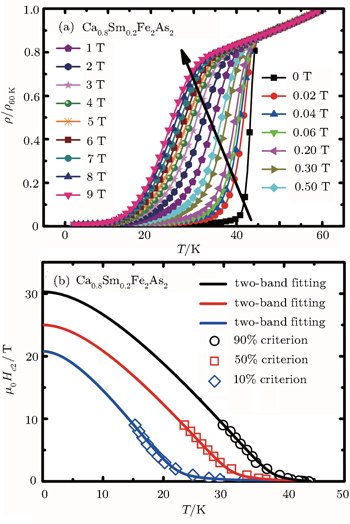
To estimate the upper critical field, the resistive superconducting transition for a Ca0.8Sm0.2Fe2As2 single crystal was characterized between 2 K and 60 K under magnetic fields of 0 T ∼ 9 T applied along the c axis, as shown in Fig. 3(a). With increasing magnetic field, the transition temperature decreases, and the transition width increases, while zero resistivity still survives at the maximal field of 9 T. The upper critical field μ0Hc2(T) was calculated using three different criteria of 90%, 50%, 10% of the normal state resistivity, which is presented in Fig. 3(b). The temperature dependence of μ0Hc2(T) curves from different criteria all show remarkable upward curvatures near Tc, and we accordingly fit the curves by the two-band theory.[37] The two-band fits agree well with the μ0Hc2(T) data and give values of μ0Hc2(0) at different criteria about 30.3 T, 25.0 T, and 20.8 T, respectively.

Fig. 3. (a) The temperature dependence of normalized resistivity between 2 K and 60 K under different magnetic fields for a Ca0.8Sm0.2Fe2As2 single crystal. (b) The upper critical field μ0Hc2 determined by resistive curves with three different criteria: 90%, 50%, and 10% of normal state resistivity, and the solid lines represent the fitting results with two-band model.

In Fig. 4 we presented the temperature dependence of DC magnetic susceptibility for all the samples, which was measured between 2 K and 60 K with both zero-field-cooling (ZFC) and field-cooling (FC) methods under a magnetic field of 10 Oe. Consistent with the resistivity results, all the samples display superconducting Meissner transition, and the onset Tc changes from 26.3 K for x = 0.00 to 43.5 K for x = 0.20, which is slightly lower than that determined by the resistive measurements. For the lower doping samples in Fig. 4(a), the onset Tc increases with the doping level x, while the diamagnetic signal is very weak, which indicates the very low superconducting volume fraction of filament type. For the higher doping samples in Fig. 4(b), the onset Tc becomes very close for all samples, while the superconducting shielding volume fraction increases quickly with the nominal Sm concentration x, which suggests that tiny increase of the Sm-doping level still improves the formation of superconducting phases.

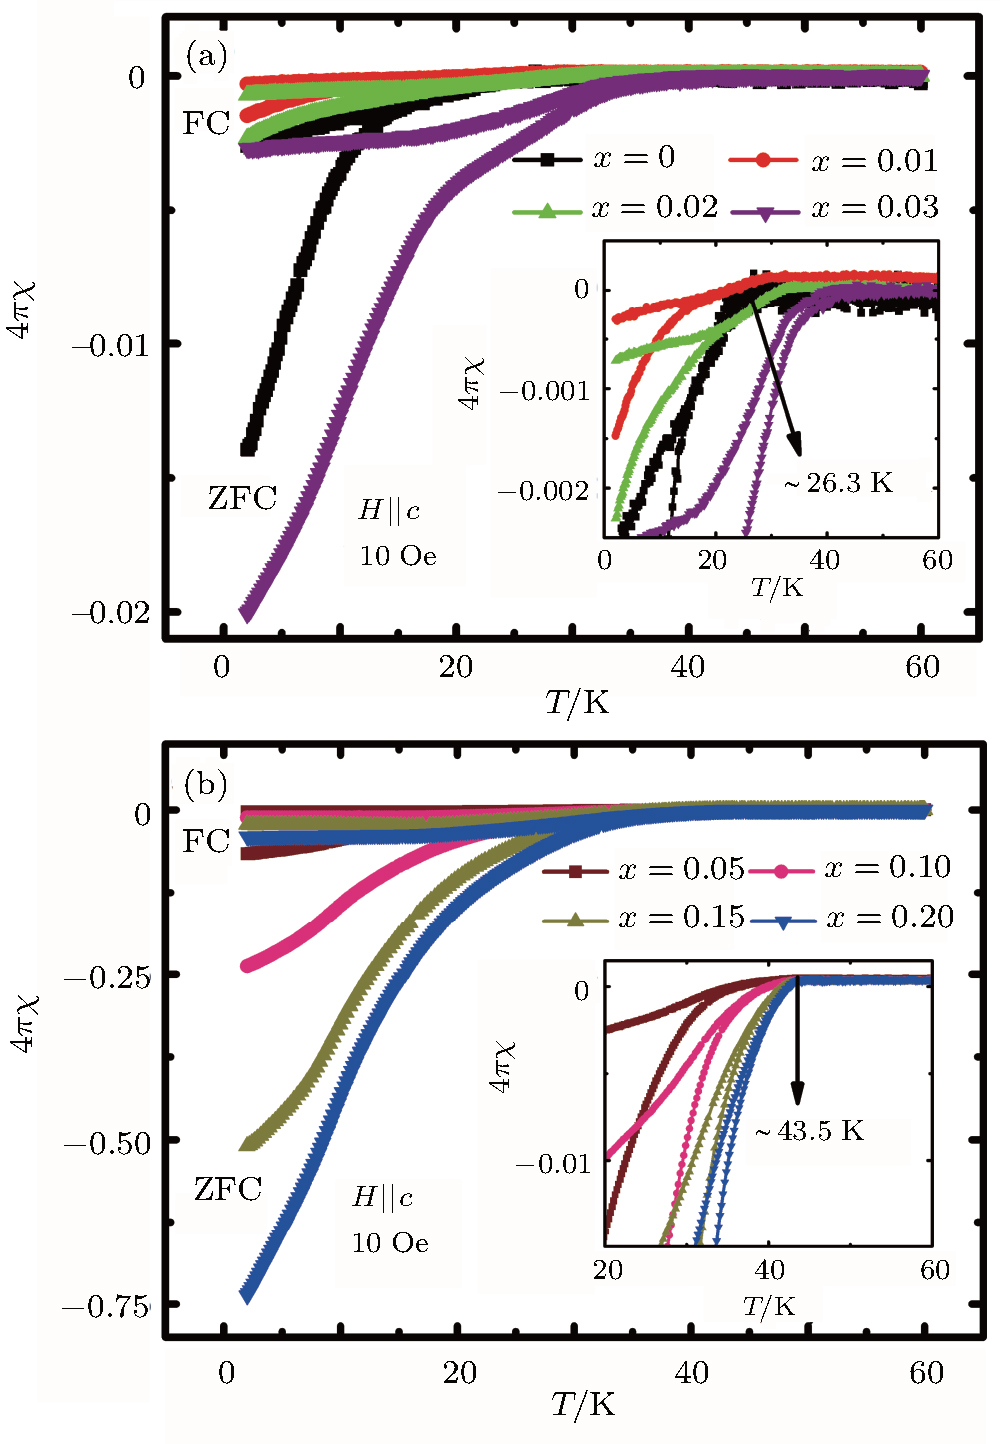
Fig. 4. The temperature dependence of DC magnetic susceptibility with both ZFC and FC measurements for the Ca1 − xSmxFe2As2 single crystals (x = 0.00, 0.01, 0.02, 0.03 in panel (a) and x = 0.05, 0.10, 0.15, 0.20 in panel (b)). The insets show the enlarged view around the superconducting transition.

In Fig. 5, we summarized the relationship for the lattice parameter c and the onset Tc versus the nominal Sm-doping concentration x. The c-axis length decreases monotonically with increasing x when x < 0.05, and accordingly, the onset Tc increases to the maximum around 44 K. And after x > 0.05, the lattice parameter c becomes almost constant, and the onset Tc show no clear change around 44 K. All these results exhibit that Sm is a successful dopant for CaFe2As2 compound, and it produces high-Tc up to 44 K in the nominal Ca0.8Sm0.2Fe2As2 single crystal with substantial superconducting volume fraction, which may be attributed to the simultaneous tuning of electron carriers doping and strain effect caused by lattice reduction.

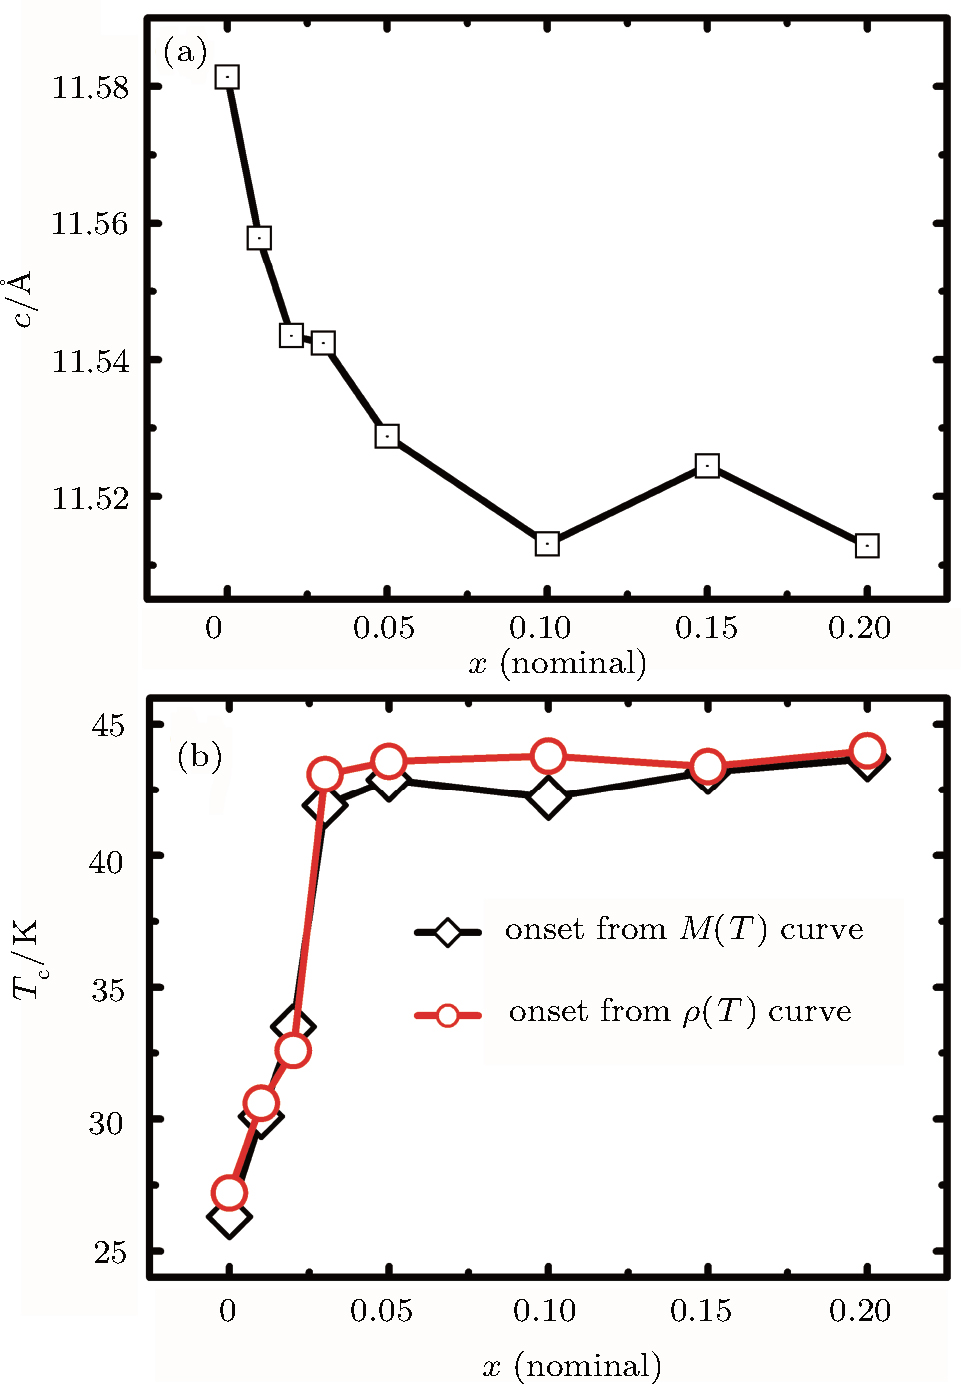
Fig. 5. The relationship between the nominal Sm-doping concentration x and (a) c-axis parameter, (b) onset Tc determined by resistive and magnetic measurements for all the Ca1 − xSmxFe2As2 single crystals.

In conclusion, we successfully grew the single crystals of Ca1 − xSmxFe2As2 (x = 0.00 ∼ 0.20) using a CaAs flux method followed by a rapid quenching process. The Sm-doping was elucidated by the reduction of c-axis parameter with increasing x, and superconductivity was observed in all the Sm-doped crystals. High-Tc superconductivity up to 44 K was proved by both the resistive and magnetic measurements in the Sm-doped CaFe2As2 single crystals.

Reference
1Howard C JCarpenter M A 2012 Acta Crystallogr. 68 209
2Jiang HSun Y LXu Z ACao G H 2013 Chin. Phys. 22 087410
3Ni NNandi SKreyssig AGoldman A IMun E DBud’ko S LCanfield P C 2008 Phys. Rev. 78 014523
4Goldman A IArgyriou D NOuladdiaf BChatterji TKreyssig ANandi SNi NBud’ko S LCanfield P CMcQueeney R J 2008 Phys. Rev. 78 100506
5Ren Z ALu WYang JYi WShen X LLi Z CChe G CDong X LSun L LZhou FZhao Z X 2008 Chin. Phys. Lett. 25 2215
6Matsubayashi KKatayama NOhgushi KYamada AMunakata KMatsumoto TUwatoko Y 2009 J. Phys. Soc. Jpn. 78 073706
7Li Z CLu WDong X LZhou FZhao Z X 2010 Chin. Phys. 19 026103
8Zhao KLiu Q QWang X CDeng ZLv Y XZhu J LLi F YJin C Q 2010 J. Phys.: Condens. Matter 22 222203
9Wang D MShangguan X CHe J BZhao L XLong Y JWang P PWang L 2013 J. Supercond. Novel Magn. 26 2121
10Kasahara SShibauchi THashimoto KNakai YIkeda HTerashima TMatsuda Y 2011 Phys. Rev. 83 060505
11Rotter MTegel MJohrendt D 2008 Phys. Rev. Lett. 101 107006
12Saha S RButch N PDrye TMagill JZiemak SKirshenbaum KZavalij P YLynn J WPaglione J 2012 Phys. Rev. 85 024525
13Lv BDeng LGooch MWei FSun YMeen J KXue Y YLorenz BChu C W 2011 Proc. Natl. Acad. Sci. USA 108 15705
14Gao ZQi YWang LWang DZhang XYao CWang CMa Y 2011 Europhys. Lett. 95 67002
15Qi YGao ZWang LWang DZhang XYao CWang CWang CMa Y 2012 Supercond. Sci. Technol. 25 045007
16Ying J JLiang J CLuo X GWang X FYan Y JZhang MWang A FXiang Z JYe G JCheng PChen X H 2012 Phys. Rev. 85 144514
17Zhou WYuan F FZhuang J CSun YDing YCui L JBai JShi Z X 2013 Supercond. Sci. Technol. 26 095003
18Huang Y BRichard PWang J HWang X PShi XXu NWu ZLi AYin J XQian TLv BChu C WPan S HShi MDing H 2013 Chin. Phys. Lett. 30 017402
19Sun YZhou WCui L JZhuang J CDing YYuan F FBai JShi Z X 2013 AIP Adv. 3 102120
20Chu C WLv BDeng L ZLorenz BJawdat BGooch MShrestha KZhao KZhu X YXue Y YWei F Y 2013 J. Phys: Conf. Ser. 449 012014
21Tamegai TDing Q PIshibashi TNakajima Y 2013 Physica 484 31
22Gofryk KPan MCantoni CSaparov BMitchell J ESefat A S 2014 Phys. Rev. Lett. 112 047005
23Deng L ZLv BZhao KWei F YXue Y YWu ZChu C W 2016 Phys. Rev. 93 054513
24Torikachvili M SBud’ko S LNi NCanfield P C 2008 Phys. Rev. Lett. 101 057006
25Kreyssig AGreen M ALee YSamolyuk G DZajdel PLynn J WBud’ko S LTorikachvili M SNi NNandi SLeão J BPoulton S JArgyriou D NHarmon B NMcQueeney R JCanfield P CGoldman A I 2008 Phys. Rev. 78 184517
26Ran SBud’ko S LPratt D KKreyssig AKim M GKramer M JRyan D HRowan-Weetaluktuk W NFurukawa YRoy BGoldman A ICanfield P C 2011 Phys. Rev. 83 144517
27Zhao KStingl CManna R SJin C QGegenwart P 2015 Phys. Rev. 92 235132
28Danura MKudo KOshiro YAraki SC. Kobayashi TNohara M 2011 J. Phys. Soc. Jpn. 80 103701
29Ma LJi G FDai JSaha S RDrye TPaglione JYu W Q 2013 Chin. Phys. 22 057401
30Yang RLe CZhang LXu BZhang WNadeem KXiao HHu JQiu X 2015 Phys. Rev. 91 224507
31Saha S RDrye TGoh S KKlintberg L ESilver J MGrosche F MSutherland MMunsie T J SLuke G MPratt D KLynn J WPaglione J 2014 Phys. Rev. 89 134516
32Xu D FShen D WJiang JYe Z RLiu XNiu X HXu H CYan Y JZhang TXie B PFeng D L 2014 Phys. Rev. 90 214519
33Kudo KIba KTakasuga MKitahama YMatsumura JDanura MNogami YNohara M 2013 Sci. Rep. 3 1478
34Wei FLv BDeng LMeen J KXue Y YChu C W 2014 Philos. Mag. 94 2562
35Chen D YYu JRuan B BGuo QZhang LMu Q GWang X CPan B JChen G FRen Z A2016arXiv: 1604.04964
36Gao BLi XJi QMu GLi WHu TLi AXie X 2014 New J. Phys. 16 113024
37Gurevich A 2003 Phys. Rev. 67 184515