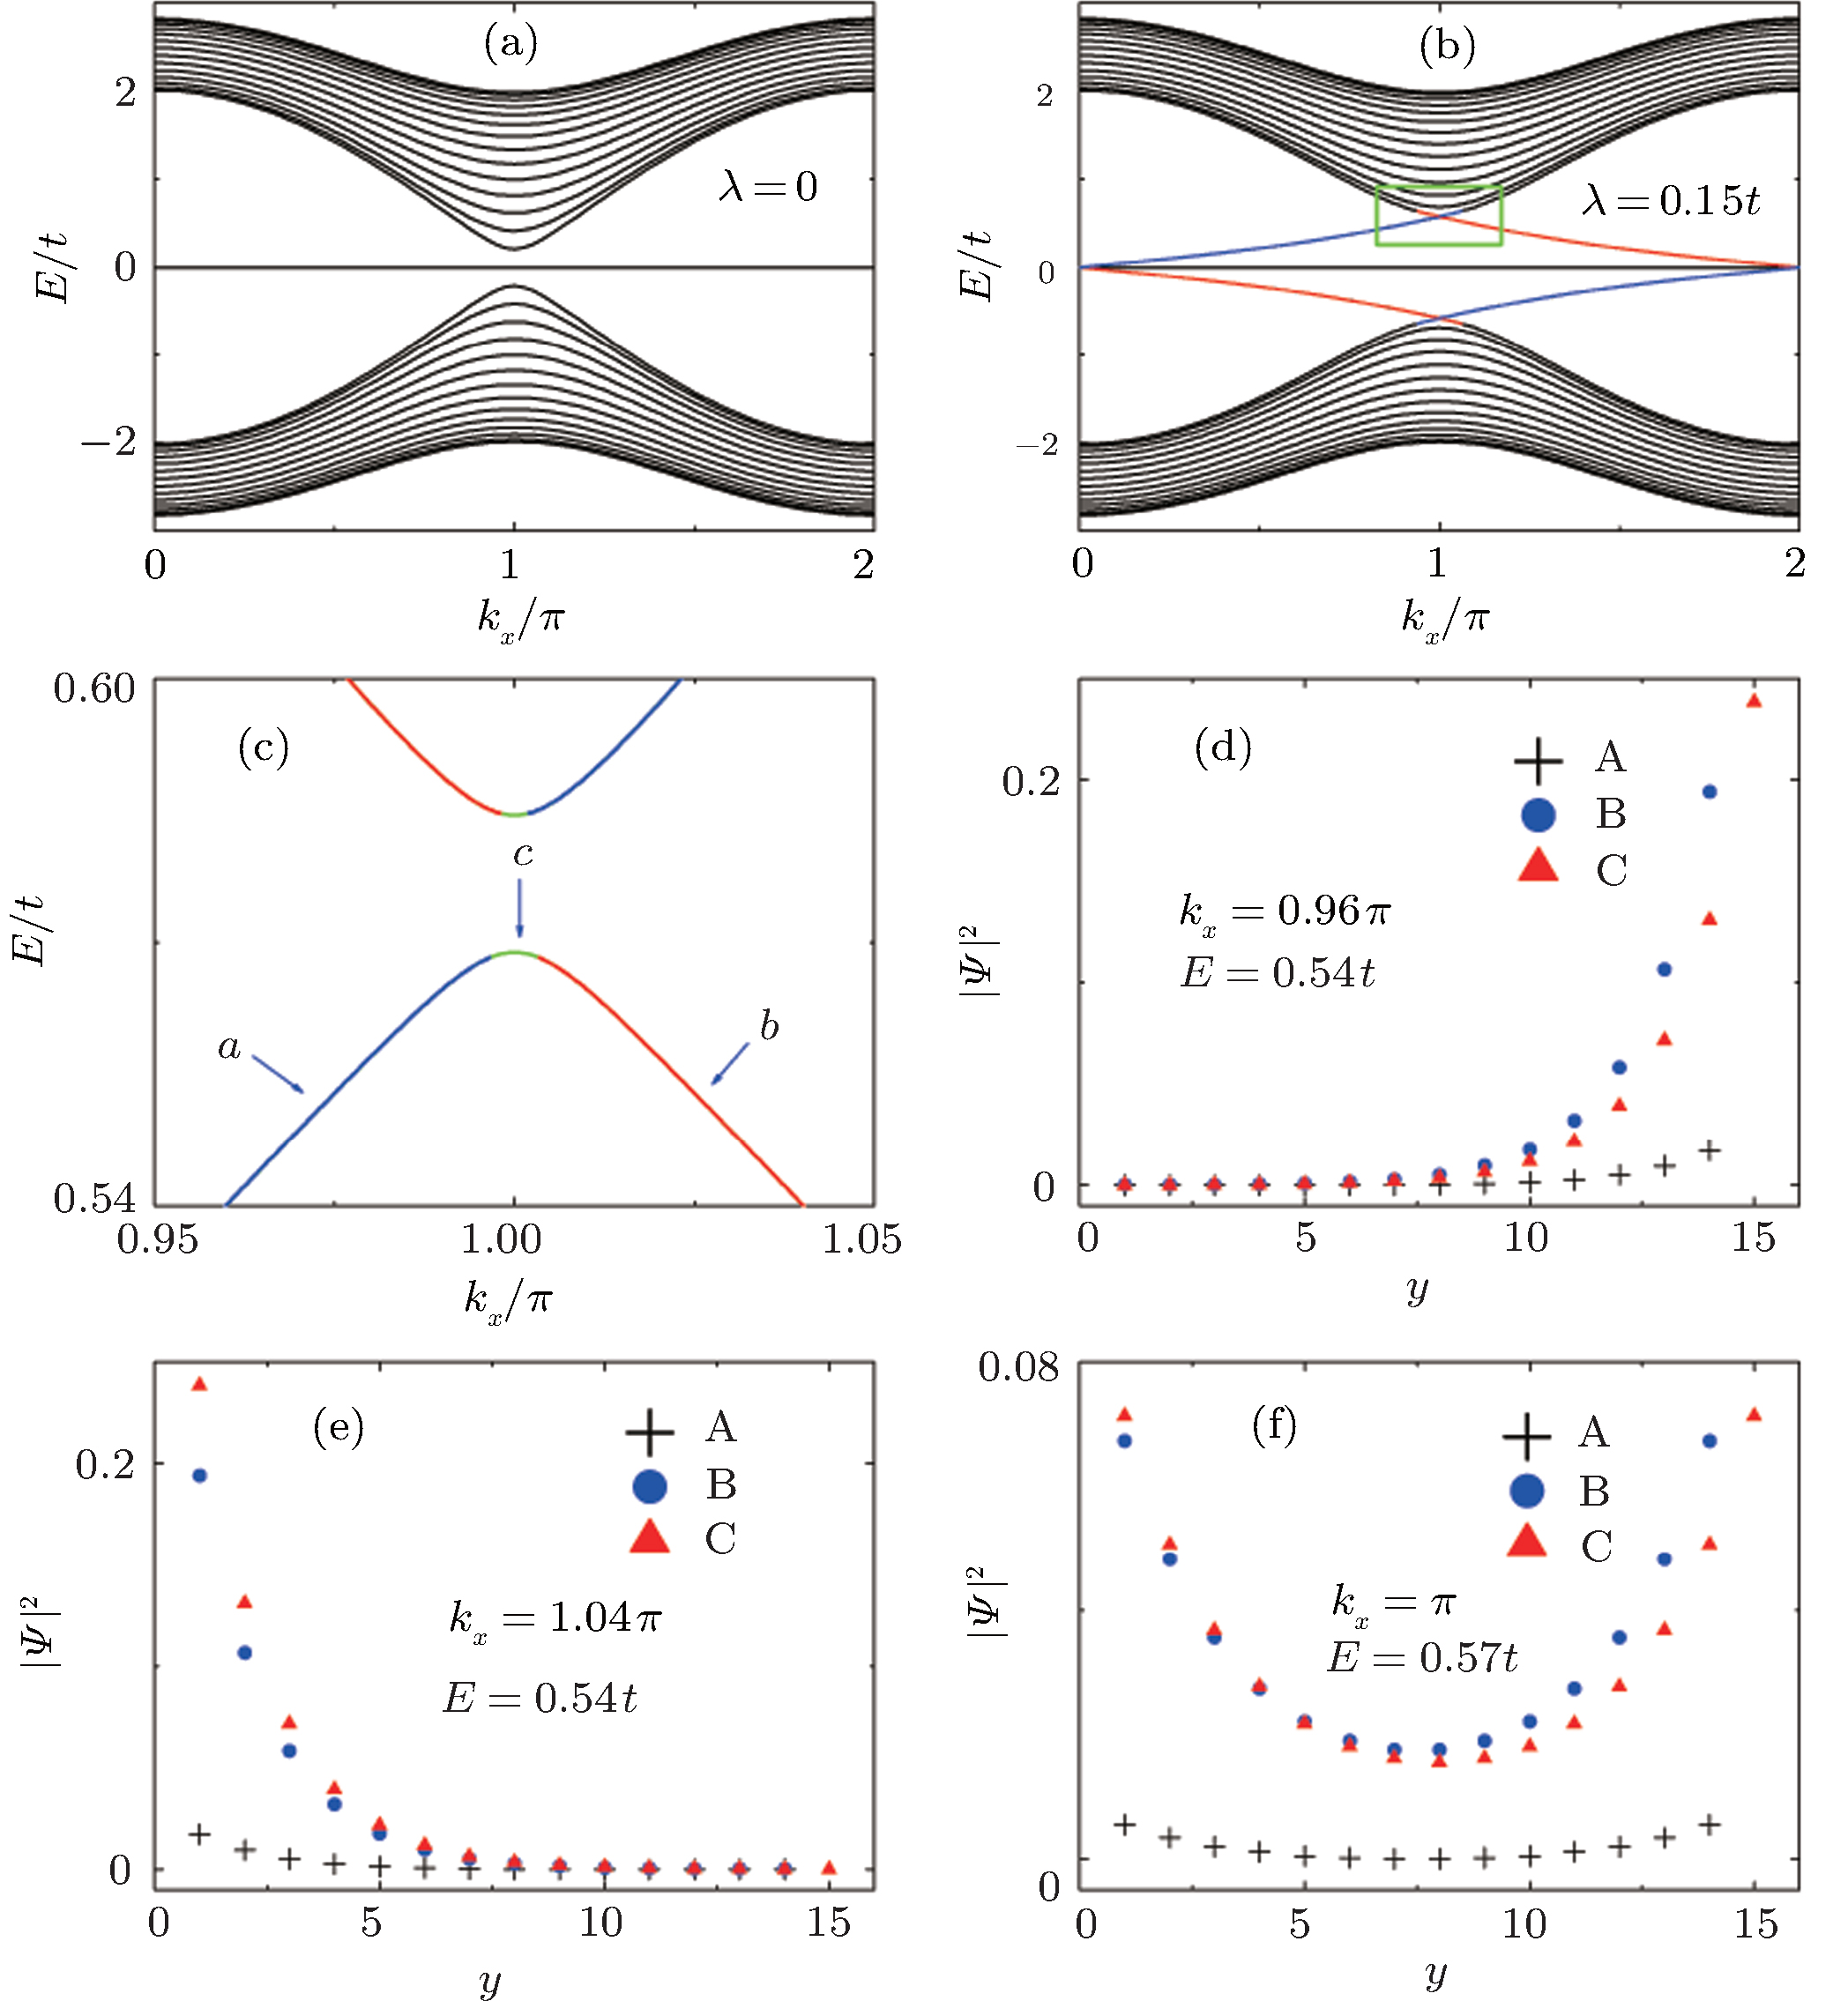
Band structure and wave function distribution of H↑ in a strip geometry with the bearded edges and the number of unit cells n = 15 along the y-axis direction. (a) The energy spectrum for the case without ISO coupling (λ = 0). (b) The energy spectrum for the case with ISO coupling (λ = 0.15t). The red (blue) lines correspond to the edge modes whose wave function distribution are mainly located in the upper (lower) edge. (c) The larger version of the green rectangle in (b). The green lines correspond to the region in which two edge states on the upper and lower edges strongly couple together. (d), (e) and (f) are the wave function distribution corresponding to points a, b, and c shown in panel (c), respectively. Here, A, B, and C denote three types of atoms on the Lieb lattice presented in Fig. 1(a). |

