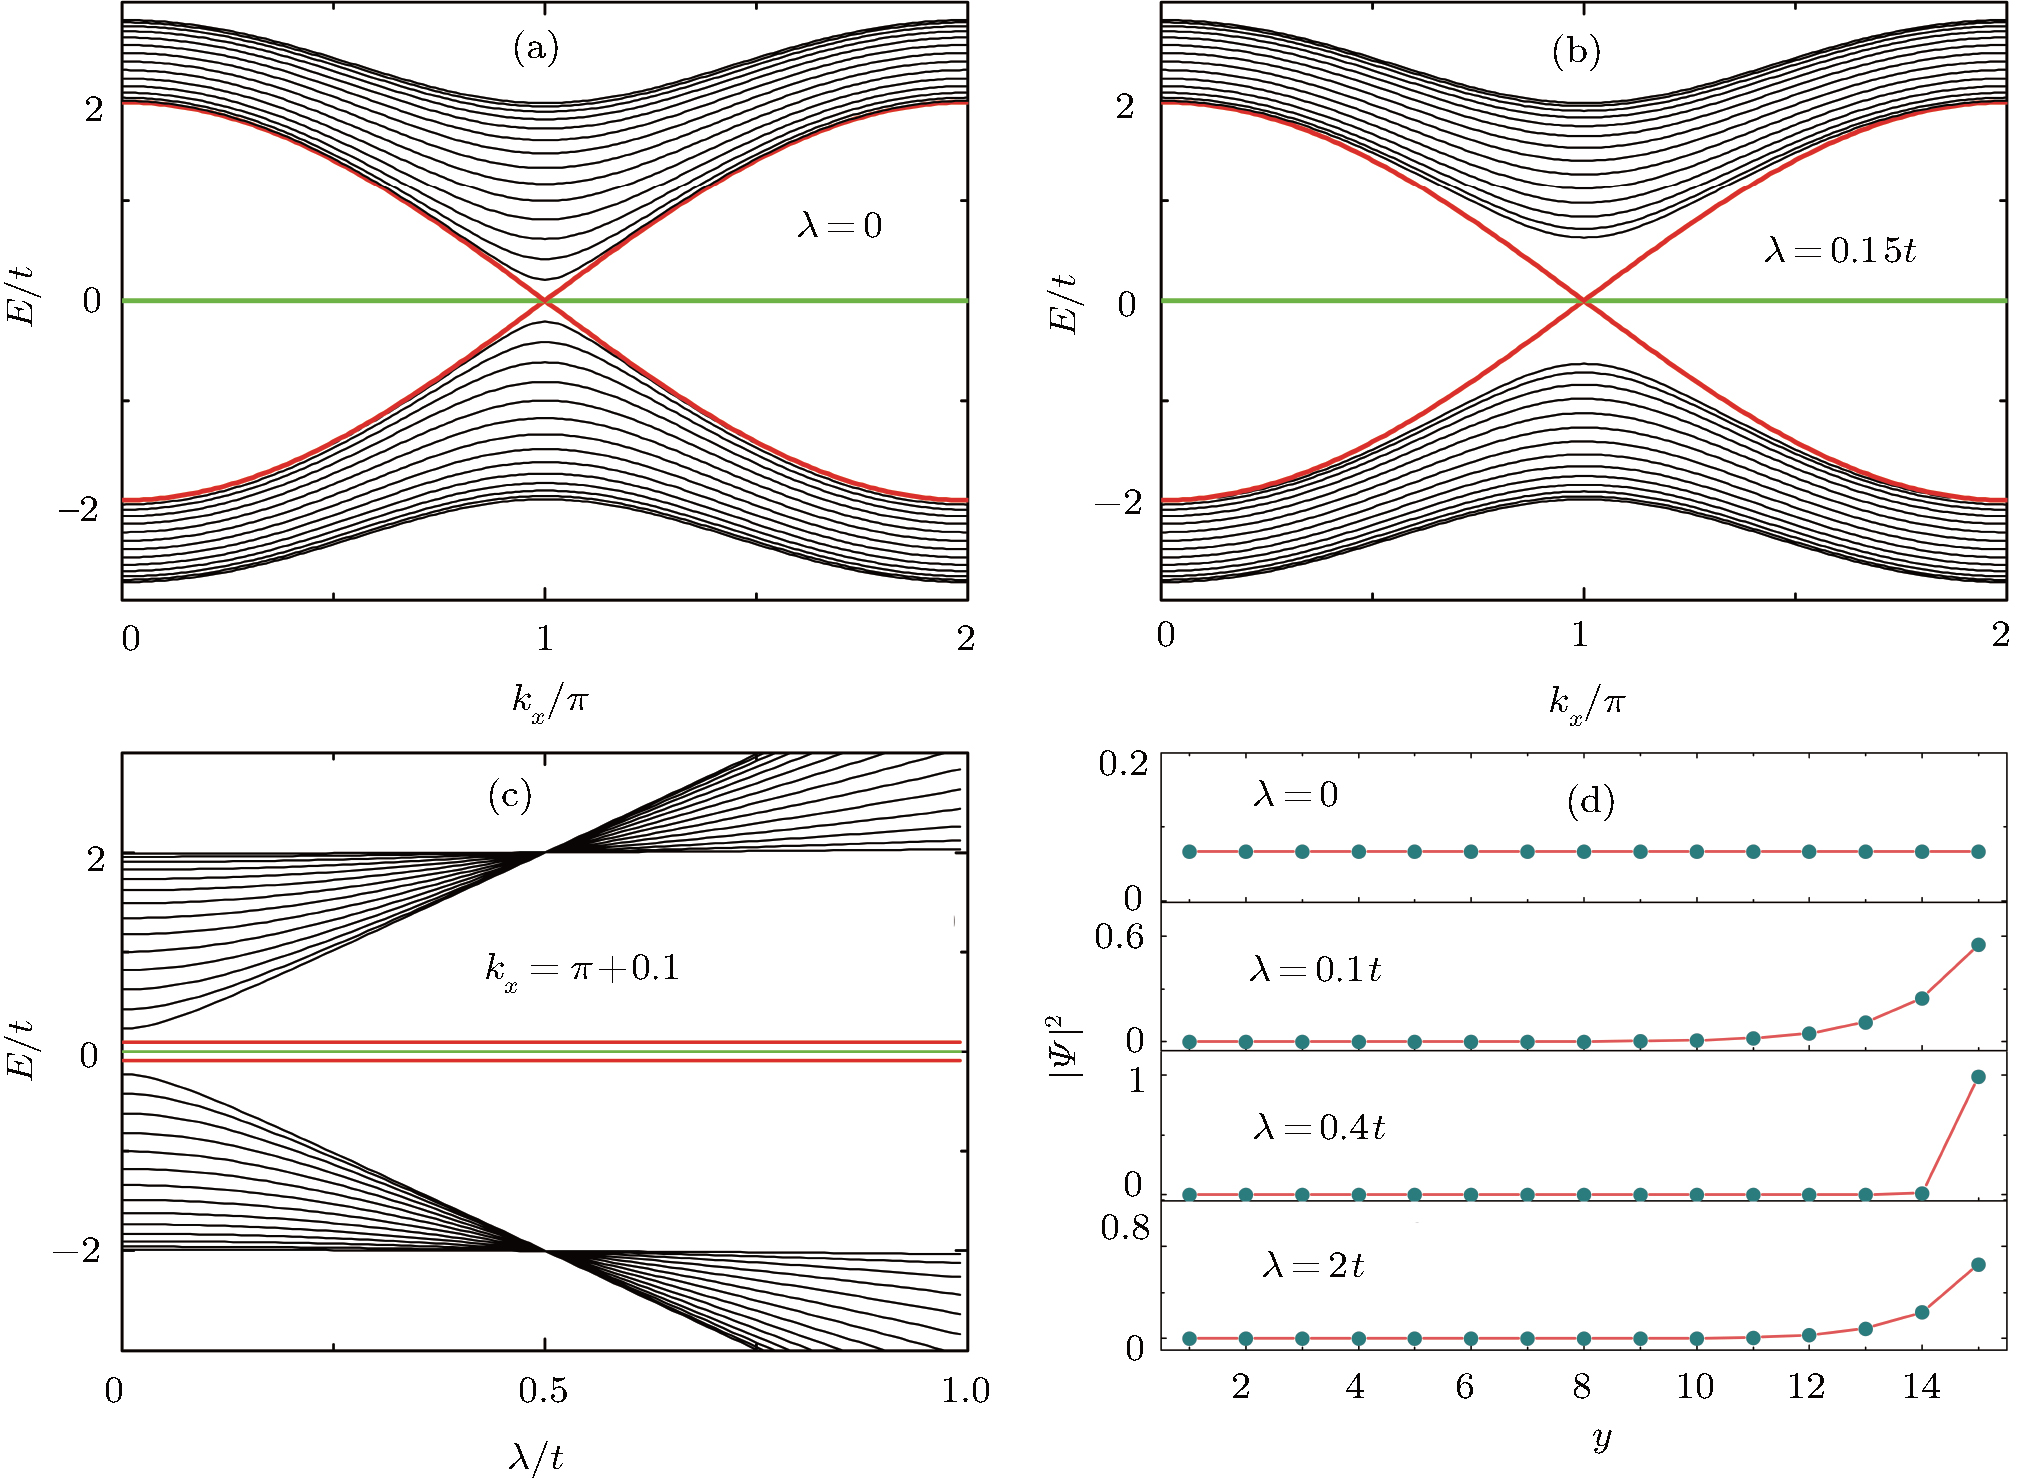
Band structure and wave function distribution of H↑ in a strip geometry with the straight edges and the number of unit cells n = 15 along the y-axis direction. The green line corresponds to the flat bands. (a) The energy spectrum for the case without ISO coupling (λ = 0). The red lines correspond actually to bulk states. (b) The energy spectrum for the case with ISO coupling (λ = 0.15t). The red lines corresponds to edge states. (c) The variation of spectrum with λ for kx = π + 0.1. (d) The density distribution of wave function corresponding to the upper red line (E = 0.1t and kx = π + 0.1) in panel (c) for different values of λ. |

