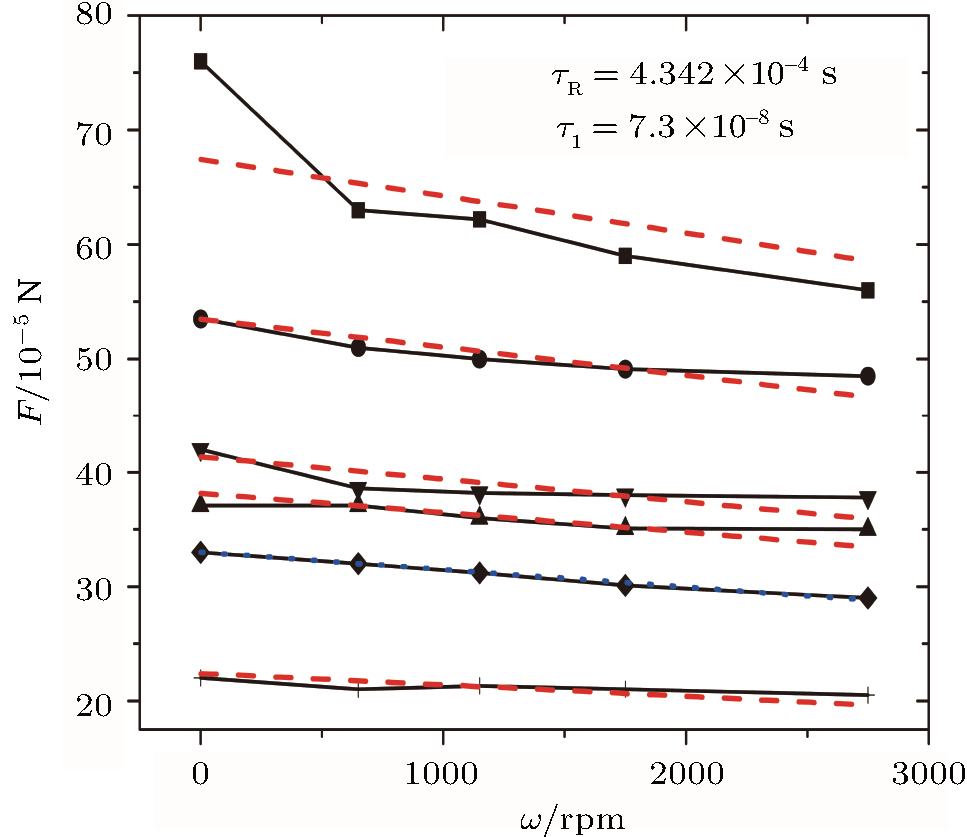
Fitting of the experimental data of a rotating metallic particle (copper) and a stationary metallic one (copper) in an AC electric field with frequency ω0 = 300 Hz. The symbols denote the experimental data which are extracted from Ref. [36]. From upper to bottom: R = 19.314 mm (or gap = 0.254 mm) and E0 = 100 V/mm; R = 19.441 mm (or gap = 0.381 mm) and E0 = 100 V/mm; R = 19.314 mm (or gap = 0.254 mm) and E0 = 80 V/mm; R = 19.568 mm (or gap = 0.508 mm) and E0 = 100 V/mm; R = 19.441 mm (or gap = 0.381 mm) and E0 = 80 V/mm; R = 19.568 mm (or gap = 0.508 mm) and E0 = 80 V/mm. Similarly, according to our theory [Eq. (20)], the dotted line is plotted by choosing appropriate relaxation times, τR = 4.342 × 10⁻⁴ s and τI = 7.3 × 10⁻⁸ s, for the fitting of the case of R = 19.441 mm (or gap = 0.381 mm) and E0 = 80 V/mm. The two values, τR = 4.342 × 10⁻⁴ s and τI = 7.3 × 10⁻⁸ s, are then used for fitting the other five groups of the experimental data (dashed lines). In this figure, the unit of ω, “rpm”, stands for “rotations per minute”. |

