† Corresponding author. E-mail:
‡ Corresponding author. E-mail:
Project supported by the National Natural Science Foundation of China (Grant Nos. 21476172 and 51172160), the National High Technology Research and Development Program of China (Grant No. 2013AA050905), and the Natural Science Foundation of Tianjin, China (Grant Nos. 12JCZDJC28400, 14RCHZGX00859, 14JCTPJC00484, and 14JCQNJC07200).
Organic salts such as spiro-(1,1')-bipyrrolidinium tetrafluoroborate ([SBP][BF4]) dissolved in liquid acetonitrile (ACN) are a new kind of organic salt solution, which is expected to be used as an electrolyte in electrical double layer capacitors (EDLCs). To explore the physicochemical properties of the solution, an all-atom force field is established on the basis of AMBER parameter values and quantum mechanical calculations. Molecular dynamics (MD) simulations are carried out to explore the liquid structure and physicochemical properties of [SBP][BF4] electrolyte at room temperature. The computed thermodynamic and transport properties match the available experimental results very well. The microscopic structures of [SBP][BF4] salt solution are also discussed in detail. The method used in this work provides an efficient way of predicting the properties of organic salt solvent as an electrolyte in EDLCs.
The electrical double layer capacitor (EDLC), which is also frequently called super-capacitor or ultra-capacitor, is a potential electrochemical device for energy storage.[1] Because there occurs no redox reaction at the interface between the electrode and the electrolyte, the electric charge or discharge processes are entirely controlled by the Coulomb electrostatic force, and thus the EDLC shows quite a high energy density. The most important technological development for EDLC is to improve not only its power density but also its lifecycle and safety. The operational temperature, potential range and conductivity are important factors of electrolyte for further developing the EDLC. In general, the electrolytes including those based on water, ionic liquids (ILs) as well as organic salt solvents are potentially good candidates for EDLCs.[2] Although a water-based electrolyte can supply a large energy density, its operation voltage has never exceeded a value of 2.0 V.[3–5] A high-operative voltage is probably realized for the EDLC by using organic solvents. Nowadays, the EDLC is generally based on the electrolyte which is quaternary ammonium salts dissolved in organic solvent such as liquid acetonitrile (ACN) or liquid propylene carbonate (PC).[6] Although a higher operative voltage can be achieved using IL instead of organic solvent, the shortcomings of IL such as high viscosity and low conductivity should be overcome to improve the performance of IL-based EDLC under normal conditions.[7] Besides, the relatively high price of IL is another issue to prevent the IL-based EDLCs from being commercialized.[8] The above statement shows that each kind of electrolyte has its own advantages and disadvantages. Many efforts should be made to develop novel electrolytes for high-performance EDLCs in the near future.[9] Electrochemical and physicochemical properties of novel organic salt solutions or new ILs should be explored by either experiments or simulations.
Porous carbons with various pore volumes were often employed for the EDLC electrodes. In 2006, Chimola et al.[10] found that the capacitance of the EDLC increases abnormally when the pore size is smaller than 10 Å. Dissolution of ion in small pores might be the main reason for the anomalous enhancement of capacitance as well as energy density. The experimental work has motivated many molecular dynamics (MD) simulation investigations on the EDLCs at molecular level.[11–14] Most of the electrolytes used in simulations are ionic liquids except for those used by Yang et al.[11] and Feng et al.,[12] in which tetraethylammonium tetrafluoroborate(TEA-BF4) salts with organic solvents were employed as electrolytes. To the best of our knowledge, other quaternary ammonium salts have not been investigated using molecular simulations. One of the difficulties for quaternary ammonium simulation is a lack of parameters for force fields. However, developing new organic salts is an important step for the realization of EDLC and the molecular simulation technology can play an important role in understanding the mechanism of EDLC and also in designing the EDLC at molecular level. Therefore, it is necessary to develop and refine the force field for quaternary ammonium salts.
Recently, much attention has been paid to a new organic salt, the spiro-(1, 1)-bipyrrolidinium tetrafluoroborate (abbreviated as [SBP][BF4]), due to its good electrochemical properties such as small ion size, high solubility and high conductivity.[15,16] Perricone et al.[17] obtained a methoxypropionitrile(MP)/ethylene carbonate(EC) mixture-based electrolyte of 1 M [SBP][BF4]. The electrolyte presents high capacitor performance. Zheng et al.[18] prepared an anode of EDLC with non-porous carbon microbeads and found that the SBP cations may enlarge the storage of capability of the negative electrode. Yu et al.[19] and Shi et al.[20] synthesized [SBP][BF4] salt and measured the electrochemical performances of [SBP][BF4] with several organic solvents. The capacitances of the binary solvent electrolyte system could reach about 117.3 F/g at 293 K and 92.3 F/g at 323 K, respectively. The EDLC based on binary solvent system has an energy of 29.6 Wh/kg and a power density of 12.5 kW/ kg. In order to investigate the EDLC behaviors of [SBP][BF4] organic salt electrolyte, we develop a force field for [SBP][BF4] based on the framework of AMBER force field and density functional calculation. Then the force field is employed in MD simulations to predict the physicochemical properties of a mixture of [SBP][BF4] and ACN. The aim of this paper is to testify to the force field of [SBP][BF4]. In general, the simulation technique can explore the microstructure properties and dynamic properties of EDLC. An accurate force field is a prerequisite for predicting the right properties of EDLC, including electrolyte density distribution, charge distributions, orientations of ions, ionic mobilities, etc. Once the force field reproduces the right physicochemical properties of bulk electrolyte, it can be used for EDLC simulations in the future. For this purpose, we compare the simulated results with existing experimental results. Moreover the detailed microstructures of the [SBP][BF4] and ACN mixtures are explored by molecular dynamics, which are very important for developing high-efficiency EDLCs at molecular levels.
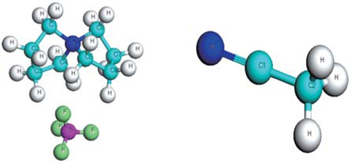
In a classical molecular simulation, the accurate prediction of physicochemical properties requires a reliable and stable force field. In the present study, a twenty-five-site model for [SBP]+ is adopted, and the structure of [SBP][BF4] was calculated by density functional of Perdew, Burke and Ernzerhof[21] implemented in Dmol3 package.[22,23] We chose the double numerical basis set with a polarization function (DNP). It was validated that the DNP basis set is comparable to 6–31 G** basis set of Gaussian basis set and Slater type orbitals, but more numerically efficient.[24,25] The geometric structure and charge distribution were calculated. Several configurations of pair ions were calculated, and the results were the same. The optimized geometries are demonstrated in Fig.
The AMBER force field[28] has been successfully utilized to predict the thermodynamic properties of protein and DNA solutions[29] as well as organic compounds and ILs.[30] In this study, the AMBER force field was selected. In the AMBER force field, the potential energy E of a system can be expressed as
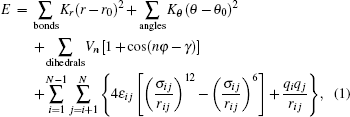


The force field parameters of [SBP][BF4] were mainly taken from the AMBER and Andrade et al.[31] The model of ACN was completely cited from Ref. [32] by Wu et al. The charges and LJ parameters of the force field are given in Table
| Table 1. Charges and force fields for [SPB][BF4] and ACN molecules. . |
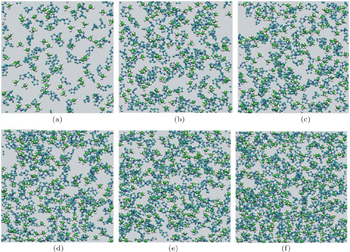
All-atoms molecular dynamic (MD) simulations in this work were carried out with the MD simulator LAMMPS.[33] MD simulations were first carried out at a constant temperature of 298 K and a pressure of 0.1 MPa. After equilibrium, the constant temperature and constant volume dynamics simulations were performed 10 ns for ensemble average. The Nose–Hoover thermostat was employed to control the temperature of simulating system.[34,35] The initial configurations are generated by a Monte–Carlo algorithm and ions can distribute evenly in electrolyte solution. The time-step was taken to be 1.0 fs. The ordinary three-dimensional periodic boundary conditions were used. The cutoff distance of simulated system was taken to be 15 Å. The particle–particle particle mesh (PPPM) algorithm was employed for the long-range Coulomb force calculations and the grid distance of fast Fourier transform (FFT) was 1.9 Å. The configurations of the system were saved every 100 time-steps in the simulations for further analyses. The concentrations of solution range from xsalt = 0.05 (0.9 M) to xsalt = 0.142 (2.2 M). The interval covers the working concentration range of organic salt electrolytes for realizing the EDLCs.[10,14,20] The details of the simulated systems and main simulated results of mixtures are shown in Table
| Table 2. Simulation results of [SBP][BF4] + ACN mixtures in this work. . |
In the table, D+, D−, D2, D are the diffusion coefficients of cations, anions, ACN molecules and the solutions.
| Table 3. Experimental results of [SBP][BF4] + ACN mixtures in this work. . |
In MD simulations, the solid of [SBP][BF4] was dissolved in ACN, and the densities of the mixtures are obtained for mole fraction xsalt in a range from 0.051 to 0.142. The simulated densities along with simulated viscosities and conductivities are given in Table
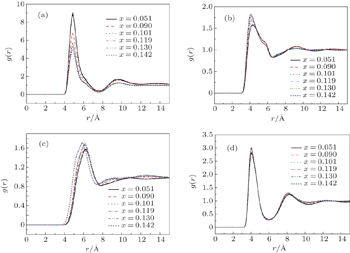
Generally, distribution functions such as radial distribution functions (RDFs) are used to characterize the structure of a fluid. The RDFs have been employed to explain the microscopic structures of IL solvents.[30,37] In this work, the bulk structure of [SBP][BF4] and ACN mixtures were studied by the site–site RDFs. The site–site RDFs for [SBP]BF4] and ACN solvent were studied and presented in Fig.
The RDFs between the nitrogen atoms of the [SBP]+ ions and the boron atoms of the [BF4]− in liquid ACN are shown in Fig.
Figure
Figure
Figure
Through the above analyses of RDFs between [SBP]+, [BF4]−, and ACN, it is concluded that interactions between cation–solvent and solvent–solvent are strengthened with the increase of the solute molecule number. The maximum peak values of RDFs between cation–ACN and the minimum peak values between cation–anion are both located at xsalt = 0.142. The values of the RDFs between different peaks are related to the radius of ion or molecule. The larger the radius, the longer the distance between adjacent peaks is in the RDFs.
Ion transport of the [SBP][BF4] electrolyte can be explored in terms of the self-diffusion coefficient, which can easily be derived from the evolution of the mean square displacement (MSD) during the MD simulations according to the Einstein relationship. The MSD[38] was evaluated on the basis of the dynamic particle coordinates via


In the present study, the self-diffusion coefficient for the binary mixture of [SBP][BF4]–ACN was approximated by[32]

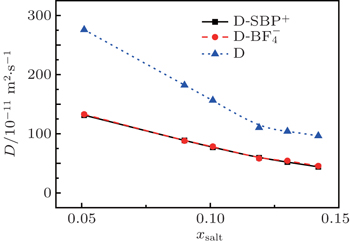 | Fig. 5. Variations of self-diffusion coefficient with mole fraction xsalt for [SBP]+, [BF4]− and ACN at T = 298 K. |
The predicted self-diffusion coefficients for cations, anions, ACN and solution are illustrated in Fig.
Figure

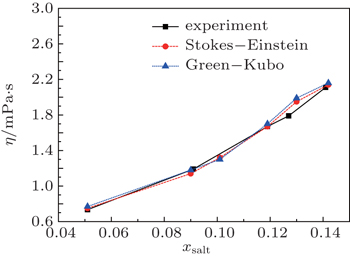
The self-diffusion coefficient of water at 298 K and 0.1 MPa is 2.3 × 10− 9 m2·s−1, and ηH2O = 0.9 mPa·s. As a result, one can calculate the viscosity from Eq. (


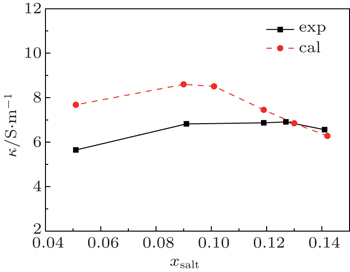
At the same time, we also measured the viscosities and electro-conductivities. These experimental results are included in Table
The Nernst–Einstein equation[43] can be used to evaluate the conductivity (κ) via

The development of electrical double layer capacitors requires an in depth understanding of the interactions between the molecules. Molecular simulations provide a powerful tool at molecular level to meet this requirement for EDLC development. In this work, a force field for an organic salt solution is developed and the MD simulations are performed to predict the densities, self-diffusion coefficients, viscosities, and conductivities of [SBP][BF4] + ACN binary solution under different conditions. The MD simulations reproduce the densities for the binary mixture of [SBP][BF4] + ACN very well. Based on the self-diffusion coefficients sampled from the trajectories of simulated systems, the viscosities of the mixtures are predicted by the Stokes–Einstein equation, which match the experimental results well. Through RDF analysis, the interactions of cation–solvent and solvent–solvent become stronger with the increase of concentration. In addition, as the mole fraction xsalt is increased, the change tendency of conductivity of mixtures is in agreement with that from the experiment.
In summary, based on the framework of AMBER and quantum mechanics calculations, the force field is developed in the present study and has been successfully applied to the binary mixtures of [SBP][BF4] and ACN. The predicted properties agree well with the corresponding experimental data. The EDLCs have higher power density than rechargeable batteries in that the electrical charge is stored in the electrical double layer formed at the electrode/electrolyte interface, which could rapidly adsorb–desorb without faradic reactions. So, the electrolytes used in EDLCs demand high electrical conductivity and low viscosity to enable the high mobilities of the electrolyte ions between the two electrodes. In other words, the electrolytes with low electrical conductivity and high viscosity supply low mobility and high electrolyte solution resistance, which is improperly used in high-power performance application. For realizing the EDLCs, new electrolytes, which have high conductivities and low viscosities, should be developed and tested. To choose and testify the electrolytes requires a large amount of experimental work. With the help of molecular dynamics simulation, based on the force field developing method presented here, it is easy to predict the viscosities and conductivities of a novel electrolyte under different conditions. Simulations will reduce the experimental jobs and save time in developing electrolytes. In conclusion, this work provides a good way to understand and estimate the macroscopic properties of the organic salt solutions that have promise to be used in the electrical double layer capacitors.
| 1 | |
| 2 | |
| 3 | |
| 4 | |
| 5 | |
| 6 | |
| 7 | |
| 8 | |
| 9 | |
| 10 | |
| 11 | |
| 12 | |
| 13 | |
| 14 | |
| 15 | |
| 16 | |
| 17 | |
| 18 | |
| 19 | |
| 20 | |
| 21 | |
| 22 | |
| 23 | |
| 24 | |
| 25 | |
| 26 | |
| 27 | |
| 28 | |
| 29 | |
| 30 | |
| 31 | |
| 32 | |
| 33 | |
| 34 | |
| 35 | |
| 36 | |
| 37 | |
| 38 | |
| 39 | |
| 40 | |
| 41 | |
| 42 | |
| 43 |


