1. IntroductionImpurity transport is one of the essential research areas for future fusion reactors. In the plasma center with high-Z impurity accumulation, power losses can be enhanced by radiation and fusion reactivity is reduced via fuel dilution. In particular, the risk of disruption increases.[1] At the plasma edge, on the other hand, impurities can help to mitigate heat flux on plasma-facing components (PFC) through strong radiative cooling in the detached plasma. The choice of tungsten as main PFC material in ITER has presented the issue of impurity as a practical concern. Therefore impurity transport needs to be not only characterized but also understood. The finding that auxiliary RF heating, especially central electron heating, has a flattening effect on the density profile of impurities and may reverse the convection direction has been reported in various devices, such as JET, ASDEX-U, DIII-D, etc.[2–6] Although the underlying physics is not well understood, this effect can be used as an approach to controlling the impurity profile, which is urgent for upcoming ITER operations.
Transient perturbation methods are generally considered to be the most suitable for the study of impurity transport in tokamaks.[7] In experiments, the perturbation consists in injecting a small amount of impurity to be investigated, both the amount of injected material and the injection time should be controllable, so as to attain an adequate response in the studied quantity yet without significantly affecting main plasma parameters and study a specific phase of discharge.[8] Four techniques have been extensively utilized in impurity injections: general gas puffing (GP), supersonic molecular beam injection (SMBI), pellet injection, and laser blow-off, which have their own merits and limitations. On HL-2A, laser blow-off (LBO) and SMBI are applied to the impurity transport study by injecting gaseous and metallic impurity, respectively. Compared with the general gas puffing, both LBO and SMBI can offer a source duration much shorter than typical impurity characteristic transport time, thus providing a clearer observation on impurity transport. The relevant experiment using the SMBI method is addressed in Refs. [9] and [10] and the experiment with LBO is presented in Refs. [11], [12] and this paper. In this experiment, trace aluminium is injected in two neighboring discharges with identical plasma parameter but the ECRH is applied during one discharge and shut off in the other discharge. The experimental setup is introduced in Section 2, where LBO system and relevant diagnostics are depicted. In Section 3, observations of trace impurity movement and impurity confinement times for the two discharges are presented. In Section 4, the numerical model in STRAHL is described. The simulation and its results are presented in Section 5. Finally, a summary is given in Section 6.
2. LBO system and relevant diagnostics on HL-2AThe HL-2A is a double null divertor tokamak with a major radius of R = 165 cm and a minor radius of a = 40 cm. It can be operated in divertor and limiter configurations independently. Typical discharge parameters are as follows: toroidal magnetic field BT = 1.2T–2.4 T, plasma current Ip = 150kA–480 kA, plasma density ne = (1−8) × 1019 m−3, and electron temperature Te = (1–5)keV.[13]
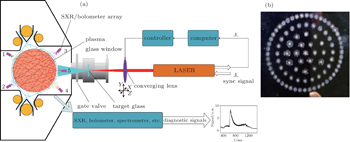
The schematic of LBO system on HL-2A is illustrated in Fig. 1(a). The laser implemented here is a YAG laser working at a wavelength of 1064 nm. The diameter of the output beam is 6 mm with a divergence of 0.5 mrad and the energy of a single pulse is set to be 0.68 J–2 J in a duration of 10 ns. The target, which is of a metal film with a typical thickness of 10 μm, coated on a quartz glass substrate, is installed inside the vacuum tube behind a glass window in the equatorial plane of HL-2A. A high transmission converging lens is installed on a step-motor driven translation stage mounted on a set of orthogonal tracks in the X and Y directions as indicated in the figure. During the laser pulse, the transient high density of energy on the impurity film vaporizes and accelerates local atoms, producing an atomic jet “blowing” towards the plasma. The quantity of injected impurity is easily adjusted by adapting the position of the converging lens in the Z direction so as to adjust the size of focal spot, and the ablation position on the target is scanned by moving the converging lens to a sequence of positions in the X–Y plane under the manipulation of a computer program. Since the first operation in 2005, several metal impurities have been successfully injected into HL-2A plasmas, including Al, Ti, Ni, Si, W, etc. It is notable that a three-dimensional (3D) vibration lens system has been recently developed and tested in discharges, enabling multi-shot injection in a single discharge at a maximum frequency of 30 Hz due to the limitation of laser, thus largely improving the efficiency, reliability and reproducibility of performance.
The most dedicated diagnostics used in this paper to monitor the progression of injected impurity ions are soft x-ray arrays and bolometric arrays. The positions of soft x-ray arrays are indicated in Fig. 1(a), and numbered as 1–5 respectively. Each array consists of 20 PIN diodes with (1–10) keV response energy. The temporal and the spatial resolutions are 20 μs and 2.5 cm, respectively. At approximately the same poloidal positions as 3, 4, and 5, three 16-channel bolometric arrays covering the spectral range of 1 eV–10 keV are installed to measure the total radiation loss, each array has a temporal resolution of 50 μs and a spatial resolution of 2.5 cm. In addition, a vacuum ultra-violet (VUV) spectrometer is used to measure the lowly ionized impurity emission for source determination in the numerical simulation. Owing to the space-resolved function of the VUV spectrometer,[14] the radial profile of impurity line emissions is measured and the impurity transport coefficients can be also obtained.[15]
An eight-chord 337-μm HCN laser interferometer is installed on HL-2A to measure the electron density profile in the central column of plasma within ρ = 0.6, where ρ is the normalized plasma radius.[16] In the outer plasma region where the density is less than 2.0 × 10¹⁹ m−3, electron density profile is measured with a 33-GHz–50-GHz microwave (MW) reflectometer.[17] The electron temperature profile is measured with an electron cyclotron emission (ECE) diagnostic tool, of which the spatial resolution and the time resolution are 2 cm and 10 μs, respectively.[18] The ECE signal amplitude is calibrated with the electron temperature measured with the Thomson scattering diagnostic.[19] If it is necessary, a fast scanning Langmuir probe is also used to measure the ne and Te profiles at the edge from the outer mid-plane of the HL-2A plasma.
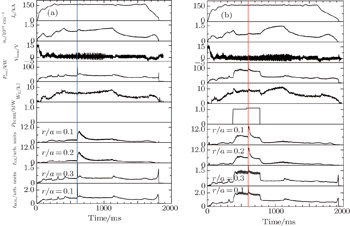
3. Experimental results with and without ECRHIn order to study the effect of ECRH on impurity transport, aluminium with ϕ ∼ 2 mm and 5 μm in thickness was injected into the ECRH L-mode discharge #22712 and Ohmic discharge #22713 at t = 600 ms. Both discharges are operated in the single null divertor configuration. The time evolutions of some plasma parameters are shown in Fig. 2. LBO injection is indicated by vertical solid lines in both discharges. The 1 MW of ECRH power deposited at the radial position r/a = 0.47 is switched on in shot #22712 during t = 380 ms–780 ms, meanwhile no auxiliary heating is applied in shot #22713. The spikes at LBO time on soft x-ray signals and bolometric signals are quite clear, whereas no obvious perturbation is observed on global parameters except total radiation. Except variations in radiation due to ECRH, signals in each channel show great resemblance. That means that the differences between the two discharges are predominantly attributed to the application of ECRH, whereas statistical fluctuations are negligible. It is thus appropriate to deduce the effects of ECRH on impurity transport properties by comparing the transport behaviors of the trace impurity from the two. It is also easily noticed that the electron density in #22712 during the ECRH phase is lower than in #22713. This “particle pump out” phenomenon is quite prevalent in the ECRH L-mode plasma with a divertor configuration in the HL-2A device.
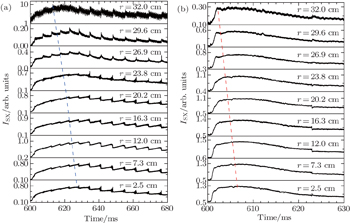
The perturbed intervals of soft x-ray signals are shown in Fig. 3 for the two discharges. After the injection, the intensities of the soft x-ray signals increase rapidly and peak sequentially from the peripheral chords to the central chords, since the dominant component of the soft x-ray is bremsstrahlung radiation, the intensity of which is proportional to the effective ion charge, ion density, electron temperature and electron density. As the impurity ions enter into the inner regions of plasma with higher electron density and temperature, the local impurity density and effective charge Z make the most contributions to the soft x-ray radiation. On the other hand, according to the corona equilibrium, the time scale of ionization is much shorter than the soft x-ray decay time. Therefore, the procession of the maximum radiation on different lines of sight from the edge to the center proximately and intuitively demonstrates the transport behavior of the injected impurity as represented in dashed lines in Fig. 3 by connecting the peaks of signal in each channel.
The distinctions in soft x-ray evolutions between the two discharges are obvious. The timescales for both rising phase and decaying phase in ECRH shot are significantly smaller than in the Ohmic regime. The slope of the dashed line which indicates the maximum of soft x-ray (SXR) on each channel for #22712 is steeper than for #22713. Considering the difference of the time range on the x-axis, a much faster transport of impurity is suggested in the ECRH regime.
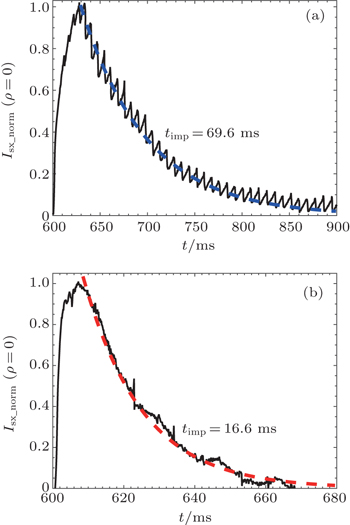
One important parameter reflecting the transport of impurity is the impurity confinement time, which is usually measured by fitting an exponential curve with characteristic time constant τ to the decaying phase of line of sight brightness of impurity radiation. This method provides a simple comparison between discharges without the need for sophisticated atomic data.[20] By assuming that the decrease of the central soft x-ray evolves in the form of Ae−t/τimp, we obtain good approximations to the decaying phase of experimental signals as shown in Fig. 4. The experimental and fitting curves are represented by solid and dashed lines respectively. The impurity decay time in the ECRH discharge is τ =16.6 ms, much shorter than τ = 69.6 ms in the Ohmic case. This further confirms that the impurity transport is strongly enhanced with ECRH.
4. Numerical modelThe numerical simulation is performed using the impurity radial transport code STRAHL.[21] The principal equations of the code are a set of continuity equations for each ionization stage of the injected impurity:

where
n and
Γ represent particle density and flux density respectively,
Q represents sink and source of a particle species, and the subscript
Z denotes the ionization stage. The physics of transport phenomenon is contained in
Γz, for which an ansatz with a diffusive part and a convective part is used in the same form as empirical expression

where
D and
V are diffusion coefficient and convection velocity respectively. The source and sink term
Qz consists of the various atomic processes between neighboring ionization stages and is expressed as
where
S,
α, and
αcx represent the rate coefficients of ionization, recombination (including radiative and di-electronic recombination), and charge exchange, respectively. The neutrals are not included in Eq. (
3) since they are considered as an external source of the first ionization stage:

on the assumption that the neutrals enter into the plasma with a uniform radial speed
υ0, the total number of the neutrals per unit time,
Φ, is given as follows:

Since the large transport parallel to flux surfaces makes densities on flux surfaces practically constant and we are interested only in the perpendicular transport, a flux surface coordinate is adopted and quantities are averaged over flux surfaces, thus reducing the continuity equations into one-dimensional (1D) equations. In the open field region outside the last closed flux surface (LCFS), which the 1D model is not very suitable for, the transport parallel to the divertor/limiter is described by a parallel loss time τ∥, and further approximated by adding a term −nz/τ∥ on the right side of Eq. (1).
The energy losses from impurities originate from the ionization, line radiation, recombination, and bremsstrahlung for tokamak plasma. The corresponding power densities of these four kinds of emissions are listed below (all in units of W·m−3)

where
M is the atomic number,
χZ is the ionization energy,
Zeff is the effective ionic charge,
χex is the excitation energy,
c1−
c4 are the constants, and
cZl are the coefficients given in Ref. [
22].
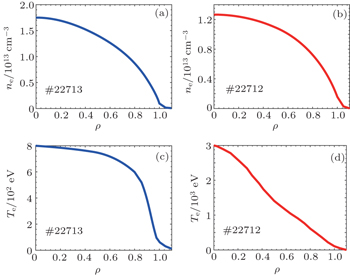
5. Simulation resultsIn the simulations, the electron density and temperature profiles are derived from HCN and ECE data respectively, and are considered to be time independent in the time interval of interest, which is shown in Fig. 5. The impurity source is set to be 1017 ∼ 1018 atoms per injection located at the last grid of mesh, with a triangular intensity in time trace. The transport coefficients, including diffusion coefficient D and convection velocity V, are set as input to STRAHL in the form of functions of radial position. The code is used to compute the radial distribution of impurity ions of all ionization stages at each time-step by solving the coupled continuity equations, and thus calculate the impurity radiation profiles in specific energy ranges with the help of atomic data provided by Atomic Data and Analysis Structure (ADAS). Further chord integrations of radiation result in quantities equivalent to detector signals of the identical chord of sight, and in this paper the soft x-ray data of a variety of lines of sight are adopted. The procedure of obtaining the experimental transport coefficients consists in iteratively operating preceding procedures until the best fitting to experiment is reached in the sense of χ2.[23]
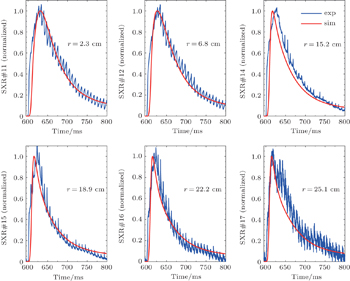
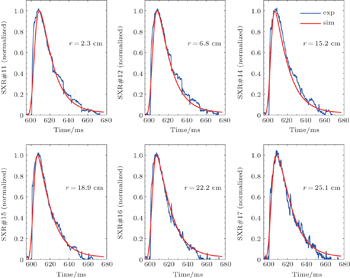
Six channels of soft x-ray fitting results are shown in comparison with the experimental data in Fig. 6 for the Ohmic discharge and in Fig. 7 for the ECRH discharge. The red dashed lines denote the simulation results and blue solid lines represent the experimental results. The background radiations before LBO have already been subtracted and the data have been normalized to their maximum values. The results show good agreement between the experiments and simulations, especially for the ECRH case in Fig. 7. There are sawteeth in the ohimc discharge, and the magnitude of oscillation is magnified after the injection of impurity. As is well known, the sawtooth oscillations indicate the magnetic reconnection processes that expel impurities from the center, resulting in a slight degradation in fitness.
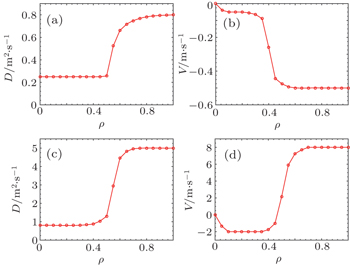
Figure 8 shows the derived radial profiles of impurity transport coefficients for the best fitting in the Ohmic and ECRH discharges, and the data used in the simulation are denoted by open circles on the curves. Considering the error of SXR signal at the edge and complex processes in the scrap-off layer (SOL), the transport parameters beyond ρ = 0.9 become inaccurate. The method to estimate the uncertainty of the derived impurity transport coefficients is introduced in Ref. [10]. It is seen in Fig. 8 that the overall tendency of the diffusion coefficient D exhibits distinctive features in three radial regions. In the central region, approximately inside ρ = 0.5, the values of D are relatively small, about 0.25 and 0.8 m2/s for the Ohmic case and ECRH case respectively, whereas in the peripheral region ρ > 0.7, the values of D substantially increase, asymptotically reaching maximum values of 0.8 and 5 m2/s, respectively. Between the two regions is a transition region where D increases steeply with radial position. The change from the Ohmic case to the ECRH case in convection velocity V shows some different features. In the central region, the value of V becomes more negative; whereas in the outside region, the direction of V is reversed and the absolute values in both regions are increased by about an order of magnitude as indicated in the case of diffusion coefficient. These facts strongly suggest that the trace impurity undergoes enhanced transport in favor of pump out effect, thereby deteriorating the confinement of impurity species. This result is also in good agreement with the previous result where the neon was injected into the ECRH discharge with SMBI.[10]
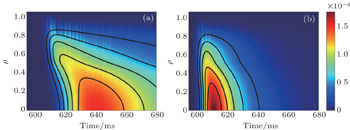
The time evolutions of soft x-ray profiles are shown in Fig. 9 by using the transport coefficients in Fig. 8. After the Al injection, the soft x-ray emissivity profile peaks first around ρ = 0.8, then moves inwards with the impurity particles progressing towards the center. The deeper location of the SXR peak at the beginning is due to the dependences of bremsstrahlung on local electron temperature and density, which are relatively low at the edge. As seen in Fig. 9, a faster temporal behavior in the ECRH case than the Ohmic case is evident by contrast, which is a sure consequence of enhanced transport parameters and conforms to the experimental measurements.
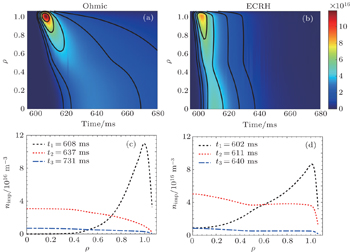
The time evolutions of the total impurity density profiles from the simulation are shown in Figs. 10(a) and 10(b) for the Ohmic and ECRH discharges, respectively. The transport process of impurity particles can be illustrated. At the beginning of the impurity injection, impurity particles peak at the plasma edge and the main existence form are of the initial few ionization stages. With the large density gradient, the impurity ions are driven into the inner region where temperature is higher. In the middle of this process, the ionization persists toward higher ionization stages, thus lowly ionized particle transport is coupled to more highly ionized particle. The overall consequence is the influx of total impurity particles until the impurity density profile peaks at plasma center. Then the diffusion term directs outwards. Compared with in Ohmic discharge, the reversal of pinch velocity in the peripheral region in the ECRH discharge reinforces the outward flux in the decaying phase, leaving a lower level of residual at the final stage of the trace impurity injection event. However the influence of reversed pinch convection is much more subtle in the influx phase. This is because the convection is overwhelmed by the diffusion during this phase when absolute density is low, due to the nz dependence of the convection term in Eq. (2).
Figures 10(c) and 10(d) show the radial profiles of impurity density at three selected time slices for the Ohmic and ECRH discharges respectively, the time peaking density reaches a maximum value, the time central density reaches a maximum value and the time central soft x-ray drops to 20% of the maximum value. With a similar source term, the profile shows the quicker penetration of injected impurity in the ECRH case. This is due to the increase of the influx in the ECRH case via the enhancement of diffusion coefficient. On the other hand, the outward convection together with a stronger outward diffusion during the decaying phase in the ECRH case helps to reduce impurity density in the core region, thus the profile exhibits a flatter shape than in the Ohmic case. Considering the fact that the time interval of t1 − t3 in Fig. 10(d) is much shorter than that in Fig. 10(c) and the density levels at the corresponding t3 are comparable, the increase of the outward flux in the decaying phase is even larger than that of the inward flux in the penetration phase. This also confirms that the overall effect of ECRH on impurity transport favors impurity pump out and impurity density profile control.
6. SummaryThe effect of ECRH on impurity transport is studied on HL-2A by injecting aluminium into the ECRH and Ohmic plasmas which have been generated in neighboring discharges with identical operational parameters except ECRH. The experiment is designed for comparative analysis. The effect of ECRH in contrast to the Ohmic discharge is characterized by a shorter duration of evolution, and this conclusion is verified by the decaying function fitting of central soft x-ray signals, with respective characteristic decay times of 69.6 ms and 16.6 ms. The numerical model of impurity transport code STRAHL is introduced and simulation is performed. The impurity diffusion coefficient D and convection velocity V are obtained by iteratively running the code to achieve the closest approximation to experimental data in the sense of χ2. The results show that the amplitudes of both diffusion coefficient and convection velocity are increased approximately by a factor of 10, and reversal of convective pinch in the outer region is derived. The good agreement between simulation results and experimental data is validated by comparing the simulated and measured chord soft x-ray emissivity. Both experimental data and simulation results confirm the pump out effect of ECRH on impurities on HL-2A as has been reported on other devices.


 , Cui Zheng-Ying, Sun Ping, Dong Chun-Feng, Deng Wei, Dong Yun-Bo, Song Shao-Dong, Jiang Min, Li Yong-Gao, Lu Ping, Yang Qing-Wei]