
Use of a plane jet for flow-induced noise reduction of tandem rods
[Zhao Kun1, 2, Yang Xi-xiang1, †,  , Okolo Patrick N2, 3, Zhang Wei-hua1]
, Okolo Patrick N2, 3, Zhang Wei-hua1]
|
|


† Corresponding author. E-mail:
Project partially supported by the European Union FP7 CleanSky Joint Technology Initiative “ALLEGRA” (Grant No. 308225).
Unsteady wake from upstream components of landing gear impinging on downstream components could be a strong noise source. The use of a plane jet is proposed to reduce this flow-induced noise. Tandem rods with different gap widths were utilized as the test body. Both acoustic and aerodynamic tests were conducted in order to validate this technique. Acoustic test results proved that overall noise emission from tandem rods could be lowered and tonal noise could be removed with use of the plane jet. However, when the plane jet was turned on, in some frequency range it could be the subsequent main contributor instead of tandem rods to total noise emission whilst in some frequency range rods could still be the main contributor. Moreover, aerodynamic tests fundamentally studied explanations for the noise reduction. Specifically, not only impinging speed to rods but speed and turbulence level to the top edge of the rear rod could be diminished by the upstream plane jet. Consequently, the vortex shedding induced by the rear rod was reduced, which was confirmed by the speed, Reynolds stress as well as the velocity fluctuation spectral measured in its wake. This study confirmed the potential use of a plane jet towards landing gear noise reduction.
Popularity of air travel has dramatically increased over the last few decades and aircraft noise is currently a major concern in aeronautical industries. Due to high bypass ratio configuration,[1,2] engine noise has been significantly reduced, making airframe noise the principal culprit for annoyance, especially in airport proximity. For this reason, airframe noise reduction, particularly the main contributor — landing gear — should be an essential consideration in the design of new commercial aircraft.[3] To reduce landing gear noise, a few techniques have been proposed and implemented. The fundamental idea behind current techniques such as fairings[4,5] and wheel hub caps[6] is to cover the landing gear with aerodynamically refined components. However, this form of passive control is limited for practical reasons, e.g., impeding visual inspection and maintenance of the landing gear. Therefore, proposal and validation of new ideas are still necessary.
In terms of the overall sound pressure level (OASPL) of noise generated by landing gear, contribution of different components depends on specifics of the actual design. Studies on flow-induced noise of various objects[7–11] have been conducted. Overall speaking, there is an approximation, i.e., sixth power law, which has been widely applied to the noise level prediction. Specifically, OASPL of the landing gear noise (component) is in direct ratio to the sixth power of local flow speed. In other words, total noise emission can be lowered by reducing local flow speed. Apart from the noise associated with direct impinging of main-flow, another important noise generation mechanism is that when turbulent wake from the upstream gear component interacts with the downstream component, which leads to excess aerodynamic noise.[12] Previous studies[12] concluded that interaction noise produced by the turbulent eddy of strength near a compact rigid body has a positive function of eddy convection velocity and correlation scale of the turbulence. Accordingly, the key to reducing the interaction noise is to reduce both convection velocity and turbulent stress in the wake flow that impinges on downstream components.[13]
In this study, a plane jet is proposed to reduce the flow-induced noise. Tandem rods were used as the test body because turbulent wake from upstream rods can cause more noise emission when it impinges on the rear rod. The plane jet can provide a good shield to tandem rods and can be simplified as a two-dimensional (2D) system to find the location of the rods. To be more specific, the idea of tandem rods noise reduction using a plane jet is to apply an upstream blowing air to deflect flow impinging the rods so that aerodynamic noise can be reduced. Both acoustic and aerodynamic measurements were performed, based on which relevant conclusions were drawn and noise reduction was firmly validated, particularly the noise generated due to interaction between the rear rod and wake from the front rod.
Figure
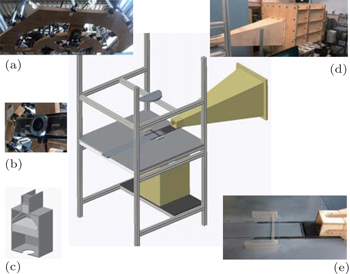
 | Fig. 1. Schematic diagram of experimental facilities: (a) Microphone array; (b) beam-forming camera; (c) plane jet plenum; (d) main-flow nozzle and the plenum; (e) rods set-up. |
As shown in Fig.
The plane jet blowing system includes a 2.2-kW centrifugal blower and a cubic plenum as well as a nozzle, shown in Fig.
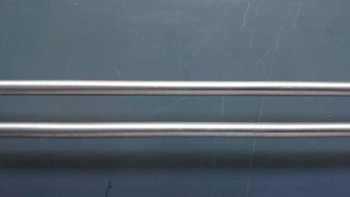
As mentioned earlier, tandem rods were used as the test object. Radius of the rods, D is 4 mm and both of them are polished (Fig.
 | Fig. 2. Tandem rods used in the test. |
As shown in Fig.
Beam-forming is an array-based measurement technique for sound source localization. It has become a standard method for spatial noise mapping. In this study, a planar semi-circular array with a camera was built, shown in Fig.
 | Fig. 3. Beam-forming calibration. |
Additionally, as the microphone array was placed out of main-flow, the refraction due to density gradient caused by the shear layer could affect the directivity of sound propagation as well as noise localization accuracy. However, since no directivity measurement was conducted and the beam-forming array was only 493 mm high to the end-plate in this study, no shear layer refraction corrections were performed.
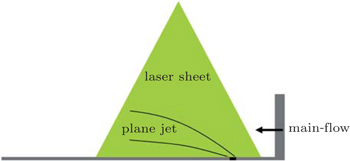
Particle Image Velocimetry, i.e., PIV, is an optical flow measurement that is capable of providing quantitative flow parameters. In the study, the flow structure without rods were visualized by DaVis low-speed PIV system. Specifically, the DaVis Flowmaster 3 CCD camera was parallelly assembled beside the end-plate, capturing the images with a Nd:YAG laser pulsing. As illustrated in Fig.
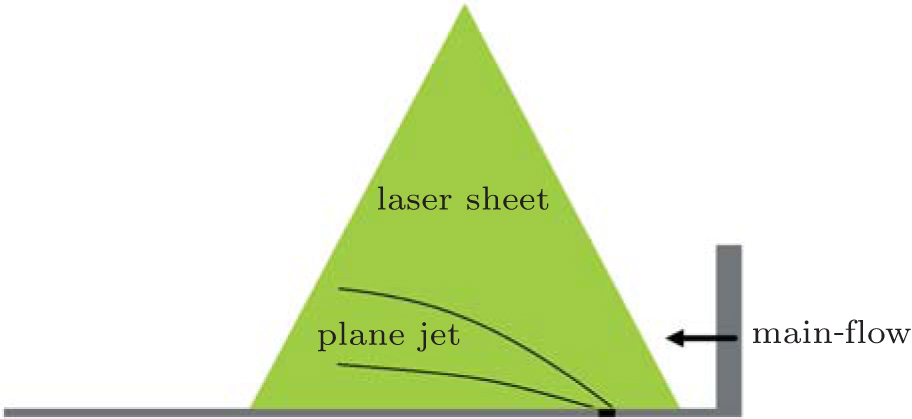 | Fig. 4. PIV measurement plane. |
The constant temperature anemometer (CTA), i.e., hot-wire anemometer, uses a very fine wire electrically heated up to some temperature above the ambient. The air flowing passing the wire has a cooling effect (forced convection) and a relationship can be obtained between resistance of the wire and flow speed. Essentially, the key to this technique is based on the principle of heat transfer and its effects on the resistance of the wire.[17] Advantages of the hot-wire anemometry can be summarized as high frequency response and high data rates, which are very helpful to measure Reynolds stress and fluctuating velocity spectrum. In this experiment, the Dantec CTA system was utilized to do the data acquisition and the probe was single-wire Dantec 55P15, which can measure one velocity component in three-dimensional (3D) system. In the test, the stream-wise component, i.e., u in x direction was measured. In addition, due to ambient temperature of the calibration and in different tests, temperature correction was applied for the measurement.[18]
Due to limitation of experimental instrumentation, it is impossible to measure the real impinging speed and Reynolds stress on the test body surfaces. As a consequence, some certain test sections were chosen to perform the measurement, which could reflect flow variation.
Figure
 | Fig. 5. Hot-wire measurement. |
In the tests, a hot-wire support tube was mounted on a vertical traverse connected to a servo motor (Animatics SM23165D). In addition, the samples were taken every D/8 in each section. As for Reynolds stress, since the single-wire hot-wire could only measure the velocity in one dimension, the stream-wise component was chosen, that is, the u′u′, which also dominated over the other stress terms. The real test set-up is shown in the following Fig.
During the test, speed of the main-flow and the plane jet were controlled to be 50 m/s (U∞) and 55 m/s (Uj). Three flow regimes were chosen to facilitate comparison. As schematically shown in Fig.
 | Fig. 6. Schematic diagram of the test campaign. |
Previous studies[19–21] demonstrated that the flow pattern behind the jet has complicated structures, and there is a low speed area behind it. Since the aerodynamic noise is in direct ratio to the 6th power of the local flow speed around the bluff-body components, it is best to put the rods in the low speed area. In this study, PIV experiment was performed to seek the location for rods.
Figure
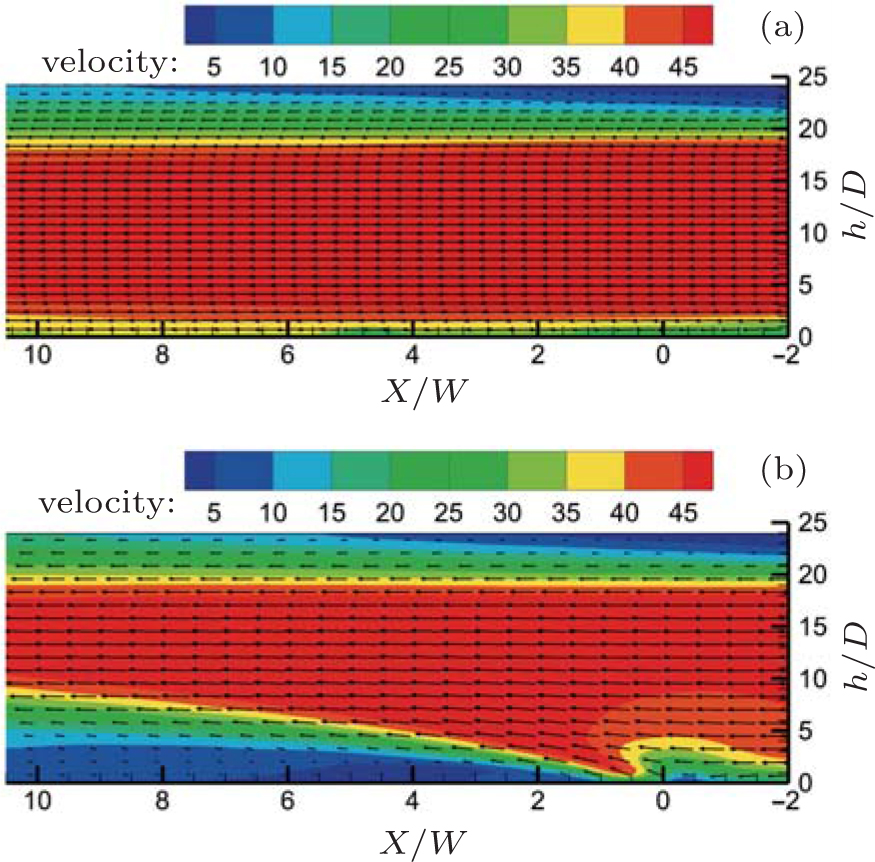 | Fig. 7. Flow velocity field for case (a) without plane jet and (b) with plane jet. |
 | Fig. 8. Velocity profile for the impinging velocity. |
In this section, test results of both acoustic and aerodynamic measurements are presented and summarized.
To validate the application for noise reduction, spectrum analysis was performed.
For spectrum analysis, one microphone in the beam-forming array was chosen, located over the tandem rods. The block size was 4096 and data were averaged over 110 blocks. The sound pressure level was referred to 2 × 10⁻⁵ Pa.
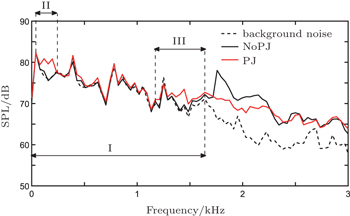
To begin with, an example was given to pre-analyse the acoustic performance, and more importantly, to find the background noise, e.g. power noise from the main-flow and the plane jet. Figure
 | Fig. 9. Background noise range. |
As shown in Fig.
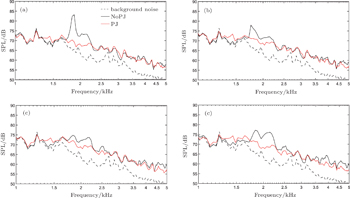
Figure
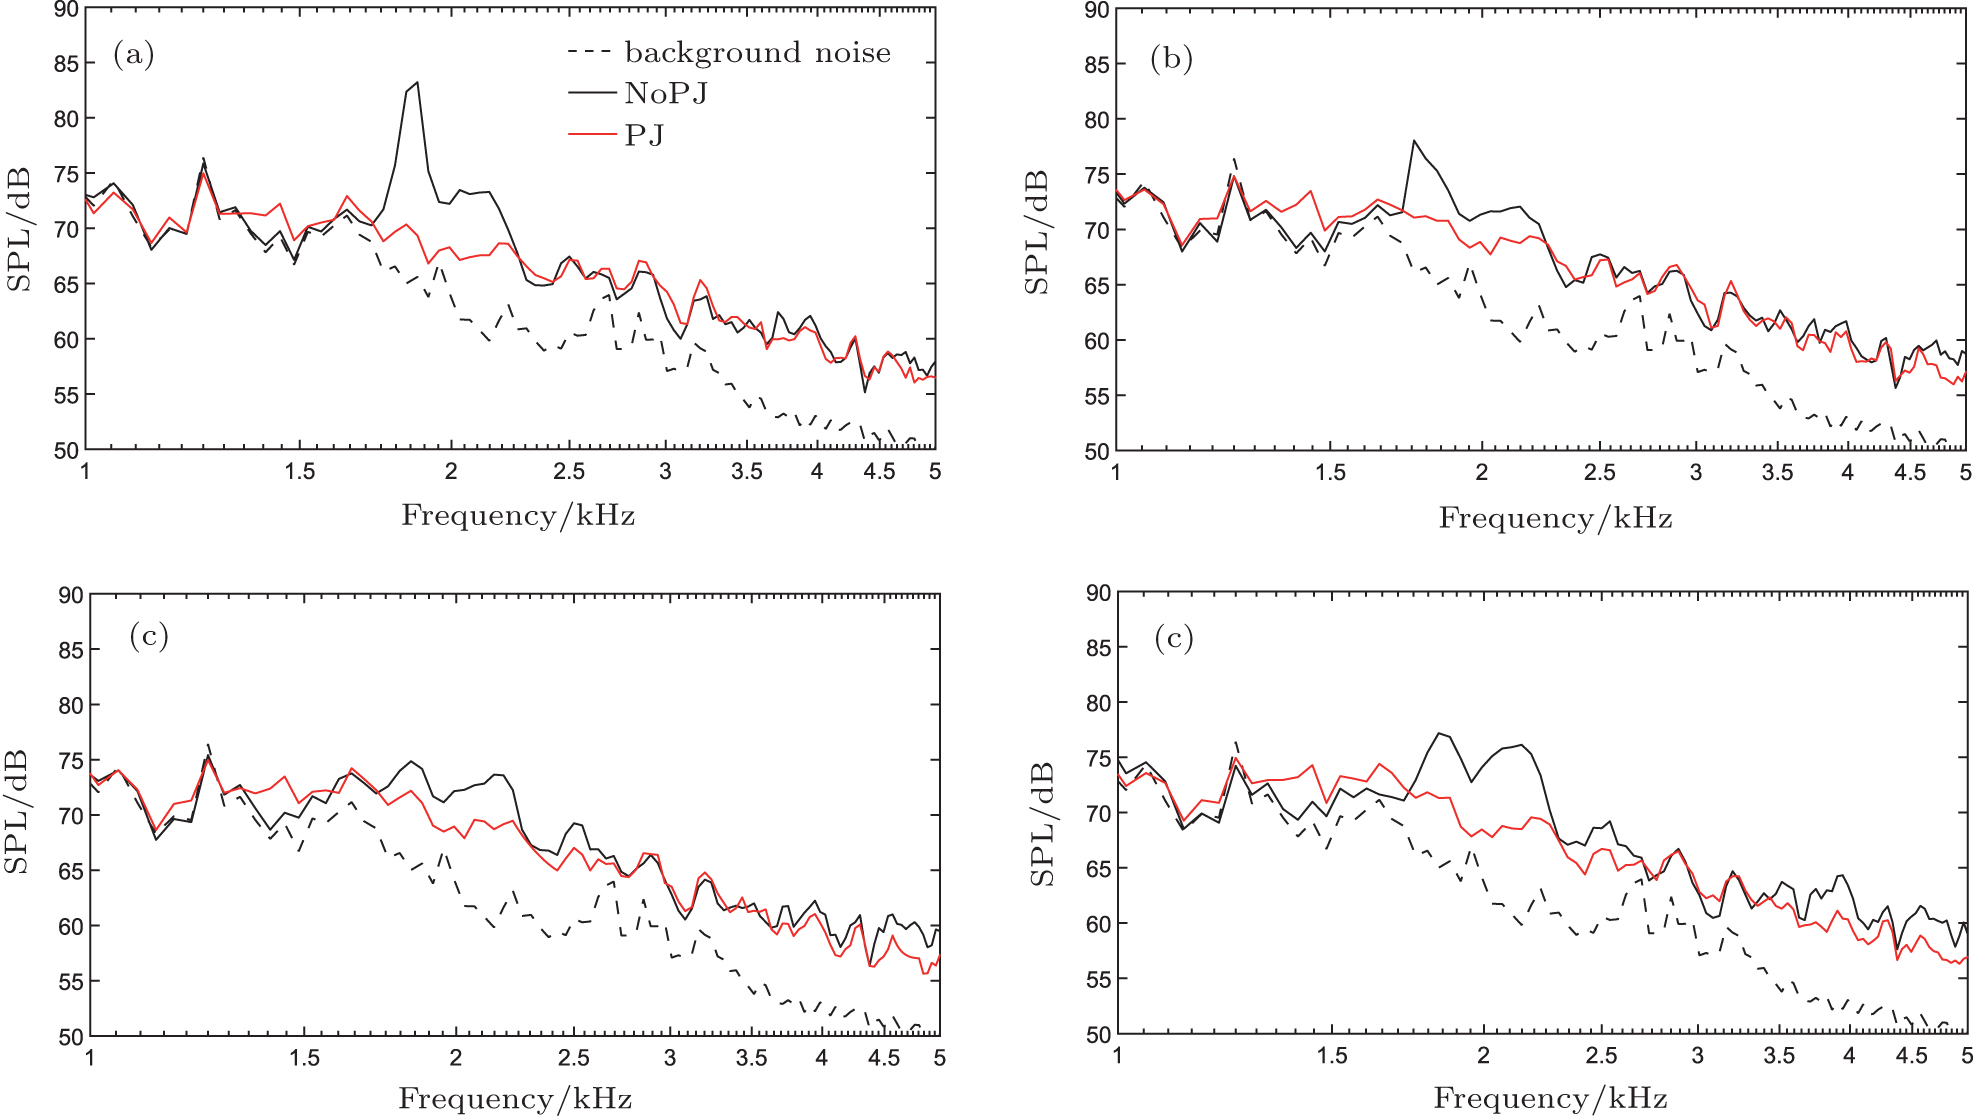 | Fig. 10. Noise spectral of different cases: (a) L/D = 2; (b) L/D = 2.5; (c) L/D = 3; (d) L/D = 3.5. |
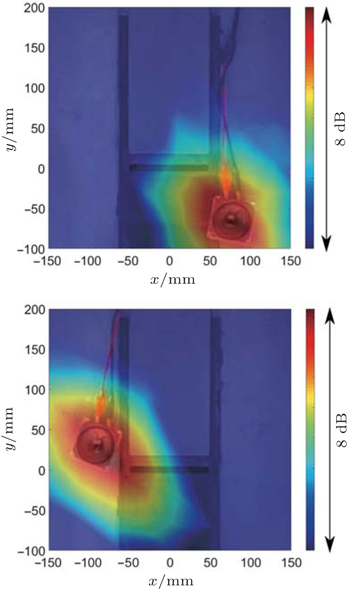
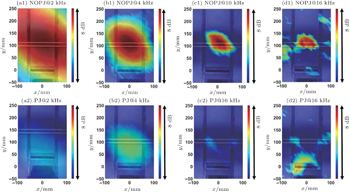
 | Fig. 11. Results (case L/D = 2) of time domain beam-forming with 1/3 octave band filter centred at: (a) 2 kHz; (b) 4 kHz; (c) 10 kHz; (d) 16 kHz. |
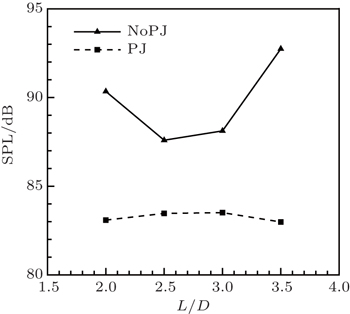
Figures
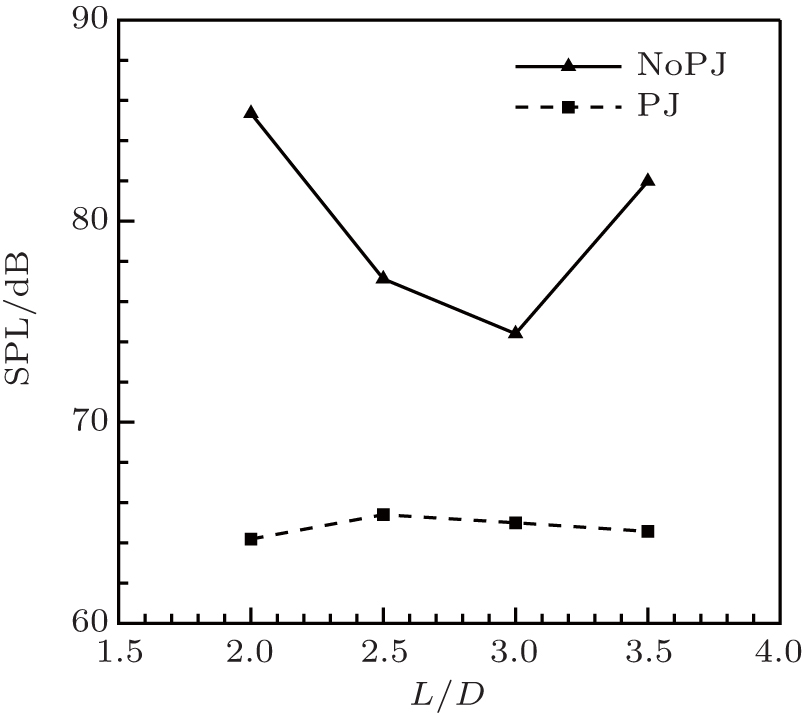 | Fig. 12. Peak reduction. |
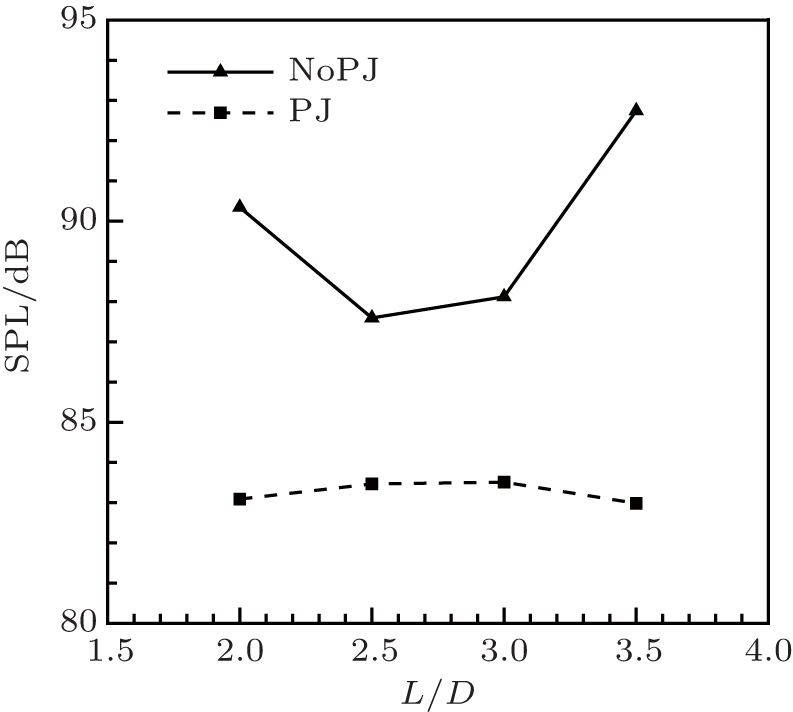 | Fig. 13. OASPL reduction. |
Figures
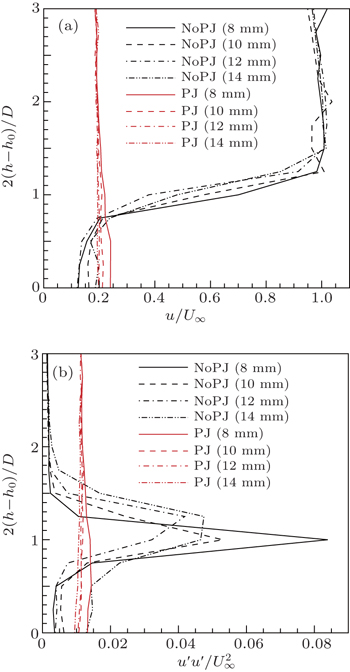
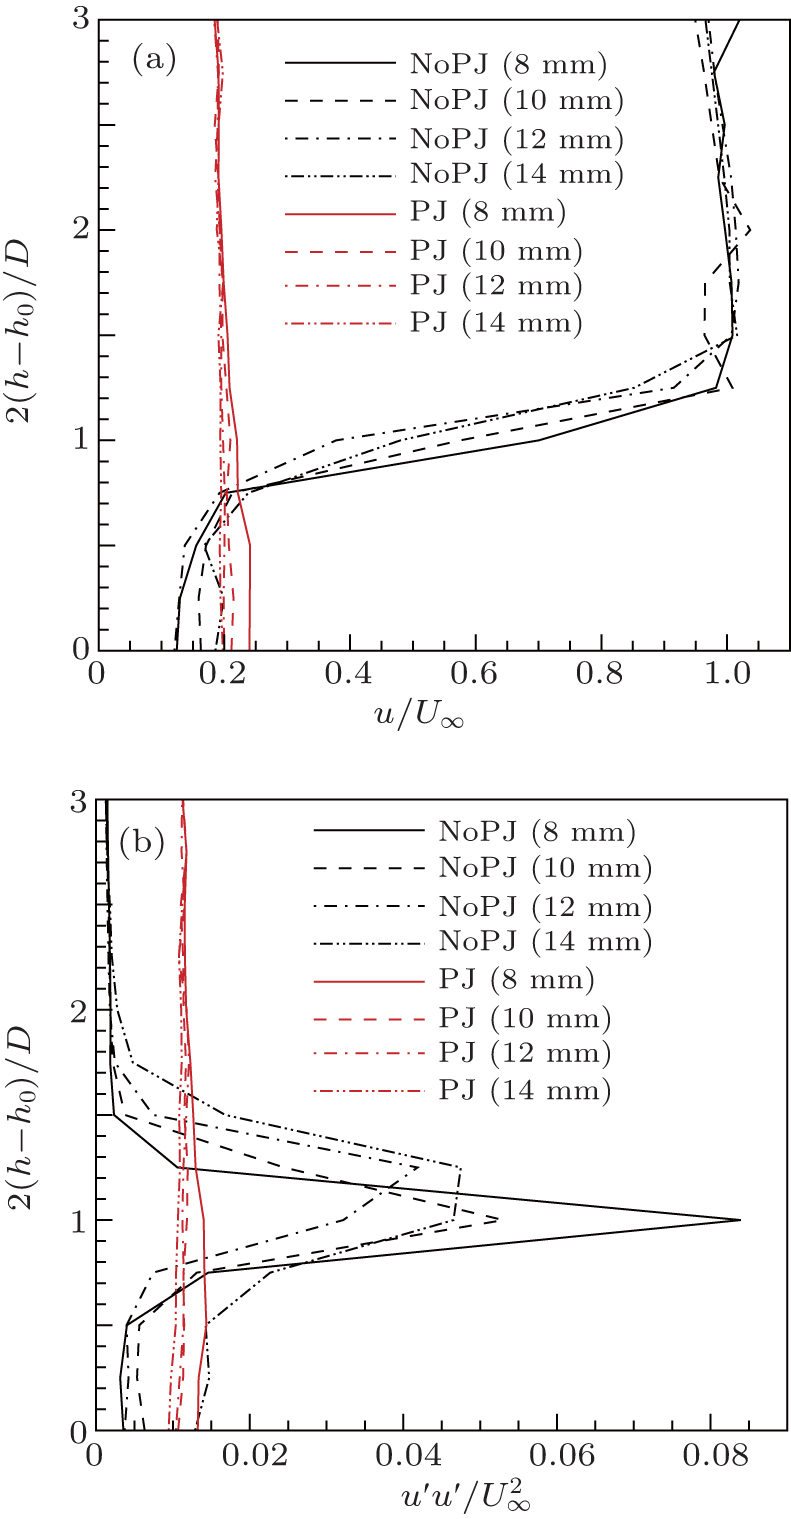 | Fig. 14. Profiles of the test section in front of the rear rod: (a) velocity; (b) Reynold stress. |
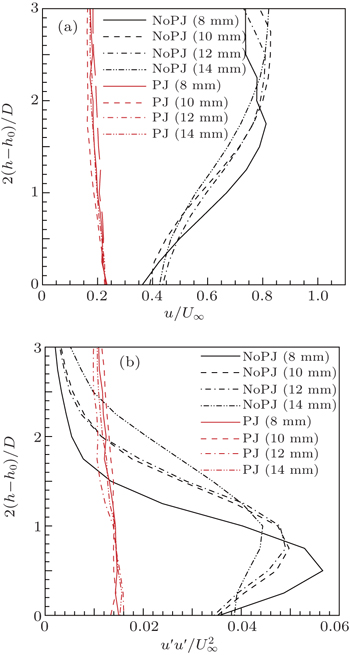
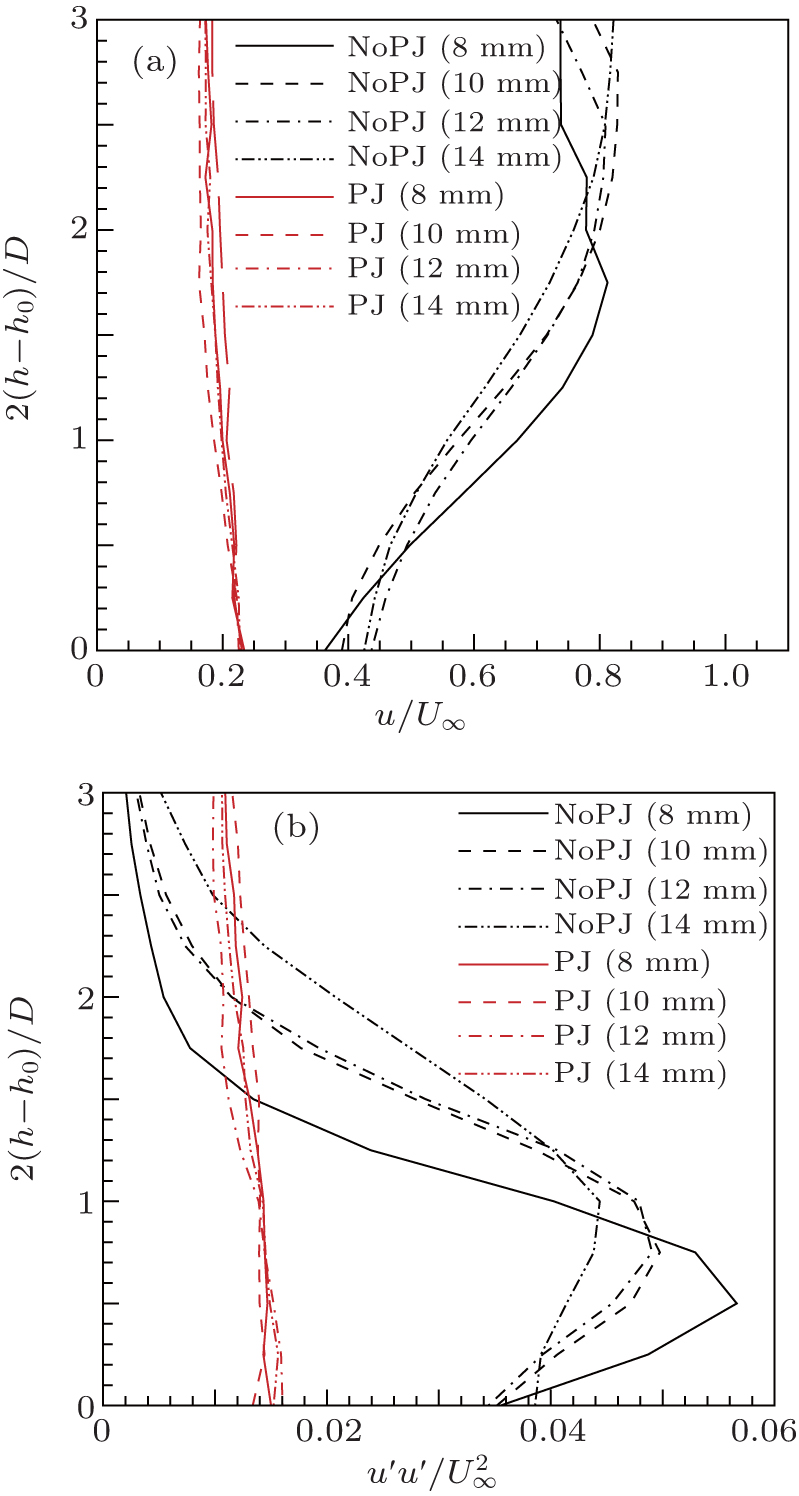 | Fig. 15. Profile of the test section behind the rear rod: (a) velocity; (b) Reynold stress. |
Apart from velocity, turbulence level also underlies noise generation. Figure
In Fig.
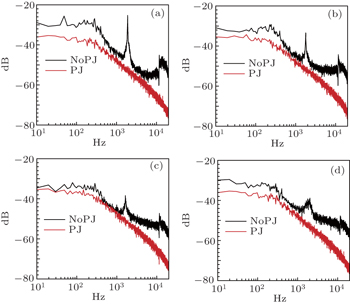
In order to further validate elimination of the vortex shedding induced by the rear rod with the plane jet, velocity fluctuation spectra for “NoPJ” and “PJ” were calculated. Since 2(h – h0)/D = 1 is the main shedding place, the analysis was chosen to be at this height. Figure

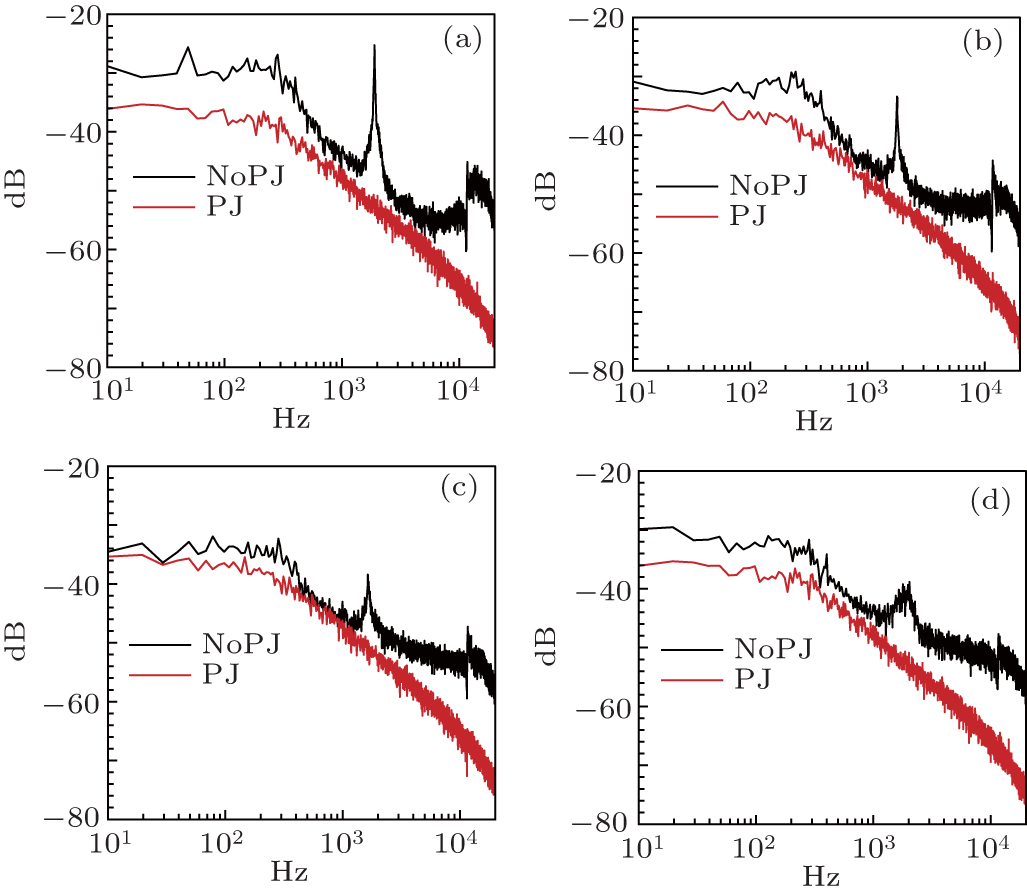 | Fig. 16. Velocity fluctuation spectral at 2(h – h0)/D = 1: (a) L/D = 2, (b) L/D = 2.5, (c) L/D = 3, (d) L/D = 3.5. |
As shown in Fig.
Once the plane jet is turned on, apparently the fluctuation significantly decreases in all frequencies, especially the peaks, as they are removed. These results further demonstrate that the plane jet can potentially be of great use to decrease vortex shedding induced by the rear rod so that noise can be reduced.
In this study, acoustic and aerodynamic measurements were conducted in the open-jet wind tunnel on tandem rods noise reduction using the plane jet. In terms of acoustic measurement, test results conclude that the plane jet can be of great use in noise reduction in terms of both tonal and broadband noise. Moreover, the spectra showed that the plane jet itself can emit noise. Noise localization illustrated that the plane jet can subsequently be a main noise source within some frequency ranges whilst in other frequency ranges rods can equally be a main source.
The aerodynamic tests fundamentally explained the reasons for noise reduction. Apart from the fact that the plane jet can reduce the impinging speed to the entire test body, it is also able to reduce turbulence levels of the flow impinging the rear rod at a height equal to that at which vortex shedding takes place. This can help diminish vortex shedding, which is validated by measurements taken behind the rear rod. Both speed and Reynolds stress inside the wake of the rear rod are considerably reduced, so is velocity fluctuation level in spectra.
As a proof-of-concept study, this research indicates the possible application of the plane jet for landing gear noise reduction, especially its usefulness on noise generated by the interaction between the wake of the front component and the rear.
| 1 | |
| 2 | |
| 3 | |
| 4 | |
| 5 | |
| 6 | |
| 7 | |
| 8 | |
| 9 | |
| 10 | |
| 11 | |
| 12 | |
| 13 | |
| 14 | |
| 15 | |
| 16 | |
| 17 | |
| 18 | |
| 19 | |
| 20 | |
| 21 | |
| 22 | |
| 23 | |
| 24 | |
| 25 | |
| 26 | |
| 27 |