† Corresponding author. E-mail:
Project supported by the National Natural Science Foundation of China (Grant Nos. 61307076 and 61275066), the National Key Technology Research and Development Program of the Ministry of Science and Technology of China (Grant No. 2012BAF14B11), and the Postdoctoral Scientific Research Developmental Fund of Heilongjiang Province, China (Grant No. LBH-Q14042).
Induced transparency phenomena and strong dispersion can be produced in a coupled resonator induced transparency (CRIT) structure. In this paper, we investigate the influences of structure parameters, such as amplitude reflection coefficient and loss, on transmission spectrum and dispersion of CRIT structure, and further study the control of dispersion in the structure. The results show that in the CRIT structure, adjusting the loss of resonators is an effective method of controlling dispersion and producing simultaneous normal and abnormal dispersion. When we choose approximate amplitude reflection coefficients of the two couplers, the decrease of transmittance due to loss could be effectively made up. In the experiment, we achieve the control of dispersion and simultaneous strong normal and abnormal dispersion in the CRIT structure comprised of fiber. The results indicate the CRIT structure has potential applications in optical signal processing and optical communication.
Nowadays the realization and application of dispersion in an optical medium is a hot topic in the field of optical physics, and the research promotes the developments of physics, such as quantum electrodynamics, quantum optics, optical information processing and optical sensing.[1–5] The early research on optical medium dispersion aimed to achieve fast light (the group velocity of light is greater than its phase velocity) or slow light (the group velocity of light is less than its phase velocity). In 1999, Hau et al. utilized the electromagnetically induced transparency (EIT) (proposed by Harris et al.[1]) to realize strong normal dispersion in ultracold atoms and a light speed of 17 m/s.[2] After that, researchers reported many methods of producing strong dispersion, such as coherent population oscillation, stimulated Brillouin scattering, and dual wave coupling.[6–8] These methods produced strong dispersions mainly by using the interaction between medium and external light field.
On the other hand, with the development of the optical waveguide technology, strong dispersion could also be produced in an optical resonator structure.[9–11] An optical resonator could be a fiber ring resonator, or Fabry–Perot resonator, or micro-ring/micro-disk resonator. The ordered arrangement of the optical resonators can form a variety of optical resonator structures with strong dispersion, such as coupled resonator optical waveguide (CROW),[9] side-coupled spaced sequence of resonator (SCISSOR),[10] and coupled resonator induced transparency (CRIT).[11] In an optical resonator structure, the dispersion is induced by the mutual coupling and interference between the resonators, so it is determined by the parameters of the resonator structures and can be formed at any optical wavelength. Also, the structures are usually comprised of optical waveguide or fiber, and thus it is compatible with current optical devices. Therefore, the optical resonator structure can be used for filters,[12,13] dispersion compensation,[14–16] enhanced nonlinearity,[17] and rotation sensing.[18,19]
The EIT-like effect originates from the destructive interference of electromagnetic fields of different pathways. There are two main schemes for the generation of the EIT-like effects: near-field coupling[20,21] and phase coupling.[22–24] The near-field coupling scheme hinges on the strength of the coupling, whereas the phase coupling scheme depends on the phase of the coupling. The CRIT is proposed by Smith et al.[11] Compared with other optical resonator structures, this structure is relatively simple, and can produce the electromagnetically induced-transparency-like effect due to the classical destructive interference of optical fields. In recent years, the CRIT has been widely investigated in optical image delay,[25] wavelength division multiplexing,[26] optical Fano resonance,[27] optical bistability,[28] and optical switching.[29,30] In the present paper, using the advantages of high transmittance, simple structure, and flexibility in designing dispersion, we investigate the control of dispersion in the structure and obtain simultaneous normal and abnormal dispersion. The results are beneficial for applications of CRIT structure in optical signal processing and optical communication.
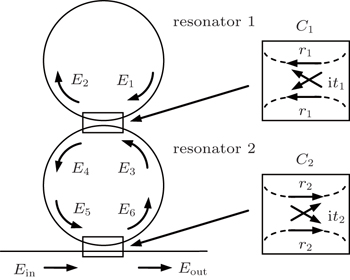
The CRIT structure shown in Fig.
Using the transfer matrix method,[15,16] we can derive the transfer function of the structure


The q-th (q is a positive integer) order dispersion coefficient is

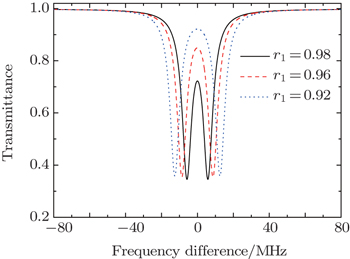
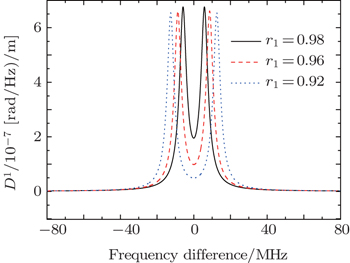
The optical characteristics of CRIT structure depend on structure parameters, such as the length of resonator, amplitude reflection coefficient and loss. The bandwidth of the structure is mainly determined by the length of resonator, and in general they are in inverse relation. Amplitude reflection coefficient affects the transmission spectrum, especially the dispersion bandwidth and the distribution of dispersion intensity. Figures
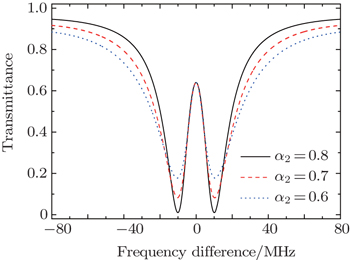
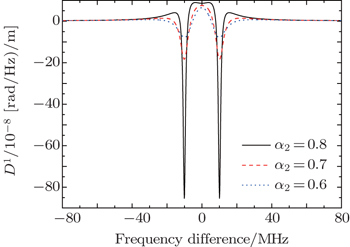
In the CRIT structure, adjusting loss is an effective method of controlling dispersion. Figures
Figure
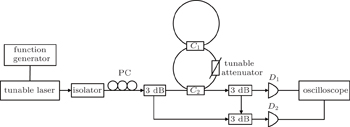 | Fig. 6. Experimental setup for measuring dispersion of the fiber CRIT structure. D1 and D2 are two detectors. PC is the polarization controller. |
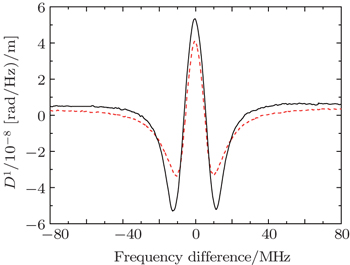
Figures
We can see that adjusting loss is an effective method of controlling dispersion in the CRIT structure. It should be noted that the loss usually reduces the transmittance of the structure. However, the transmittance also depends on the coherent effect between the two resonators. Therefore, if we choose approximate amplitude reflection coefficients of the two couplers, we can make up the decrease of transmittance due to loss.
 | Fig. 7. Experimental transmission spectra of the fiber CRIT structure with different amplitude attenuation factors. |
In this work, it is demonstrated that adjusting loss is an effective method of controlling dispersion in a CRIT structure. Meanwhile, simultaneous normal and abnormal dispersion can also be obtained by adjusting the loss. The transparency peak corresponds to normal dispersion, and the two low transmittance modes belong to abnormal dispersion. Although the loss usually reduces the transmittance of the structure, we can choose approximate amplitude reflection coefficients of the two couplers in advance to make up the decrease of transmittance due to loss.
The control of dispersion in the structure could be used in optical signal processing, such as wavelength division multiplexing and tunable optical signal delay. For example, optical signals with different center wavelengths have different group velocities due to strong normal and abnormal dispersion, so they could be distinguished in time domain. For a narrow linewidth pulse, we could tune its speed by adjusting the loss.
| 1 | |
| 2 | |
| 3 | |
| 4 | |
| 5 | |
| 6 | |
| 7 | |
| 8 | |
| 9 | |
| 10 | |
| 11 | |
| 12 | |
| 13 | |
| 14 | |
| 15 | |
| 16 | |
| 17 | |
| 18 | |
| 19 | |
| 20 | |
| 21 | |
| 22 | |
| 23 | |
| 24 | |
| 25 | |
| 26 | |
| 27 | |
| 28 | |
| 29 | |
| 30 |


