


Exploring the relationship between fractal features and bacterial essential genes
[Yu Yong-Ming1, Yang Li-Cai1, †,  , Zhou Qian2, 3, Zhao Lu-Lu1, Liu Zhi-Ping1]
, Zhou Qian2, 3, Zhao Lu-Lu1, Liu Zhi-Ping1]
|
|


† Corresponding author. E-mail:
Project supported by the Shandong Provincial Natural Science Foundation, China (Grant No. ZR2014FM022).
Essential genes are indispensable for the survival of an organism in optimal conditions. Rapid and accurate identifications of new essential genes are of great theoretical and practical significance. Exploring features with predictive power is fundamental for this. Here, we calculate six fractal features from primary gene and protein sequences and then explore their relationship with gene essentiality by statistical analysis and machine learning-based methods. The models are applied to all the currently available identified genes in 27 bacteria from the database of essential genes (DEG). It is found that the fractal features of essential genes generally differ from those of non-essential genes. The fractal features are used to ascertain the parameters of two machine learning classifiers: Naïve Bayes and Random Forest. The area under the curve (AUC) of both classifiers show that each fractal feature is satisfactorily discriminative between essential genes and non-essential genes individually. And, although significant correlations exist among fractal features, gene essentiality can also be reliably predicted by various combinations of them. Thus, the fractal features analyzed in our study can be used not only to construct a good essentiality classifier alone, but also to be significant contributors for computational tools identifying essential genes.
Essential genes are a minimal set of genes that are considered to be indispensable for the survival of an organism under most favorable conditions.[1] Identifying and predicting gene essentiality for the survival of an organism have both theoretical and practical significance in genome biology and medicine. Because essential genes are indispensable for cell viability, their protein products are attractive drug targets for new antimicrobials. A designed drug that disrupts the function of such a protein will kill the pathogens.[2,3] More broadly, essential genes provide an insight into understanding the origin of life and evolutionary relationships among species, and they are the foundation for revealing the smallest requirements for sustaining a life form, and it is critical for synthetic biology.[4,5]
Today, systematic genome-wide interrogations of essential genes have been conducted by ribonucleic acid (RNA) interference,[6] gene knockouts,[7] and transposon mutagenesis.[8] However, there are several limitations to these experimental methods: they need massive investments in time and resource; based on large-scale experiment, the speed for them to identify essential gene falls far behind that for genome sequence; moreover, the identification results may be flexible, due to different experimental conditions and criteria.[9,10] With a fast-increasing availability of genome sequence and other functional genomics data, a highly efficient computational method becomes an appealing option for circumventing those large-scale experimental methods.
Substantial efforts have been made to explore the features associated with gene essentiality, with the aim of helping design feature-based computational methods. Sequence-based features which quantitatively measure the conservative property of genes have been considered as the most powerful features for gene essentiality identification. For instance, phyletic retention,[11] domain enrichment,[12] and number of paralogs[13] which were introduced to weight the evolutionary conservation of an individual gene or local gene sequence, have been found to be very predictive of essentiality. On the other hand, some studies exist that point out that in bacteria, a higher expression level is connected with slower evolutionary speed of gene sequence.[14] Codon usage bias,[15] leading strand,[16] and fluctuation of gene expression,[17] which is generally used to measure the level of gene expression, have been clearly shown to be associated with essentiality. Moreover, Lin et al., also have suggested that the essential genes with important functions such as translation, transcription, replication, etc. are more crucial and prevailing at leading strand than those non-essential genes from other function subcategories.[18] Hawoong et al. have illustrated that in contrast to essential genes, the fluctuation of non-essential genes expression tend to be more wide.[19] Besides, other sequence-based features such as subcellular location,[20] ORF length,[21] and upstream size[22] each can be used as an index to measure the essentiality of genes as well.
In fact, genes and their protein products in cell are not isolated. They interact with each other and constitute a biological network to accomplish the biological functions of cells. While sequence-base features above extract the information from individual genes, topology-based feature which is introduced to value the properties of protein-protein interaction (PPI) networks is mainly of interest in the information about interacting protein pairs. Based on that, a group of studies have shown that topology-based features such as degree-like features, between-like features, closeness-like features and subgraph-like features, etc. are powerful and prevailing to measure the relationship between essentiality and topological properties of protein in PPI networks.[23] In addition to the features detailed above, some studies also found respectively the biological process annotation,[24] hydrophobicity of protein,[25] and synthetic accessibility,[26] etc. to be important contributors for predicting genes essentiality. Based on the integration of the features detailed above, many computational techniques have been introduced to predict essential genes.[11,19,24,27] However, there are some practical limitations to these computational methods: they are restricted to few specific model organisms, lack easily available powerful features, and perform poorly in classification accuracy. Consequently, exploring features associated with essentiality is still crucial for designing computational tools.
In recent years, some interest has been shown in applying the methods of fractal theory for analyzing gene sequences and protein sequences.[28–30] Our previous studies have also found that gene essentiality tends to be more chaotic and less structured and the fractal features, Hurst exponents and information dimension can quantitatively assess those regular complexity.[31,32] Here, while individually assessing the connection to essentiality, we also focus on measuring the relationship between those fractal features and essentiality at integrative context. All the currently available identified essential genes and non-essential genes from the database of essential genes (DEG) are analyzed. Subsequently, statistic checkout analysis is carried out to investigate the correlation and difference in fractal feature between essential genes and non-essential genes. By combining fractal features in different categories, two machine learning algorithms are introduced to calculate the average area under the curve (AUC) to quantitatively weight the predictive utility of fractal features.
DEG (
| Table 1. Information about the analysis objects. In the table, the superscript “*” indicate that these objects are protein data obtained from the same strain of the same bacterium, identified under different conditions or by different methods. the superscript “Δ” denotes that these objects are protein data obtained from the same bacterium, but from different strains, identified under different conditions or by different methods. . |
Topological entropy is a measure of complex regulation of a gene sequence. For a given gene sequence x(s), N corresponds to the length of x(s) and n is defined as a unique integer by the following equation:


Then for x4n+n−1 the first 4n + n − 1 letters of x, the definition of topological entropy of the finite sequence is

Chaos game representation (CGR) is a scale-independent representation method for genomic sequences proposed by Jeffrey in 1990.[33] In the CGR representation of a gene sequence x(s), the four bases A, T, C, and G correspond to the four vertices of a square [0,1] × [0,1]. The first point is plotted halfway between the center of the square and the vertex corresponding to the first base of the sequence x(s), and the i-th point of the plot is placed halfway between the (i − 1)-th point and the vertex corresponding to the i-th base. In this way, the CGR points are generated by an iterated function system defined by the following equation:

Information dimension is an index for characterizing fractal patterns or sets by quantifying their complexity as a ratio of the change in detail to the change in scale. We divide the CGR pattern into ɛ2 square grids of equal size, and then the side length of each grid is 1/ɛ. The numbers of non-empty grids are denoted by Z(ɛ). Dividing the number of points falling in the i-th grid by the total point number in the CGR square yields a probability Pi for the i-th grid. Information function and information dimension for the CGR are respectively defined as


The Hurst exponent is the measure of the smoothness of fractal time series based on the asymptotic behavior of the rescaled range of the process. Here, we use the method proposed by Milan Randic to convert the CGR gene map into a time series and then, estimate the Hurst exponent of the times series of gene sequence based on rescaled range (R/S) analysis method.[34] It involved the following basic steps.
For a given gene sequence x(s), F is a transformed times series over a total duration N. For a deterministic integer τ, the cumulative total at each point at different times is defined as


For a protein sequence, the detailed HP model[35] is used to divide a protein sequence into four sets: non-polar set, negative polar set, uncharged polar set, and positive polar set. Then, each protein sequence could be transformed into a new sequence composed of only four types of characters, like a gene sequence. The way we compute the fractal features of protein sequences is just the same as that we compute the fractal features of gene sequences. In such a way, gene sequence is represented by information dimension of DNA (ID), Hurst exponent of DNA (HD), topological entropy of DNA (TD), and the feature vector of protein sequence contains the information dimension of protein (IP), Hurst exponent of protein (HP) and topological entropy of protein (TP).
For most bacteria, there are much more non-essential genes than essential genes and they are classifications of highly imbalanced datasets. We solve the class imbalance problem through re-sampling, where we first randomly select semi-essential and non-essential genes as two sets, keep all genes of smaller set, and then from other sets randomly pick up the same number of genes as that of the set with fewer genes. These extracted essential and non-essential genes constitute the training sets and accordingly, all the remaining gene data are part of testing set. Naïve Bayes and Random Forest classifier are used to construct classifier model. For each bacterium, we train our classifier by using selected training set and predict the probability of essentiality for each gene in testing set by using the trained classifiers. On the basis of the true gene label and the probability of essentiality, we calculate the AUC of prediction to evaluate the classification performance. Each time, we repeat the random process 100 times, and then obtain the average AUC and its associated SD to assess the accuracy and robustness of our model, which is appropriate for the class unbalance problem.
For all 30 analysis objects, these fractal features of all essential and non-essential genes are calculated and then, Student’s T-test analysis is utilized to explore the difference of each fractal feature between essentiality and non-essentiality. Figure
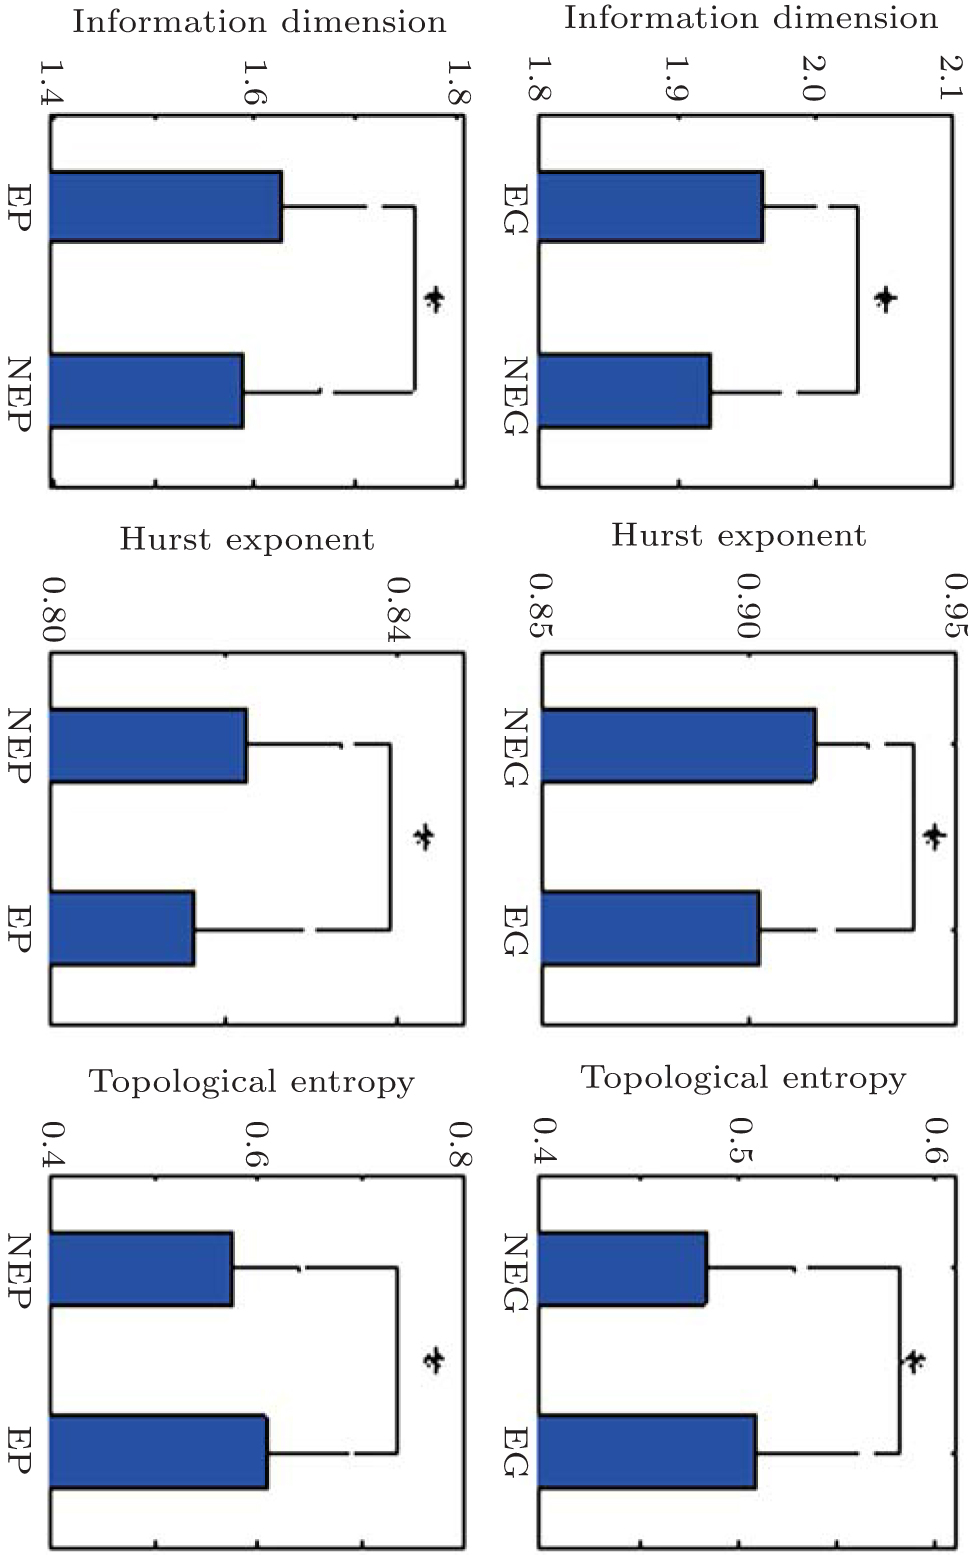 | Fig. 1. Mean values and SDs of fractal features of essentiality and non-essentialirty in S. sanguinis. * refers to significant difference existing at the 5% level. NEG: non-essential genes, EG: essential genes, NEP: non-essential proteins, and EP: essential proteins. |
In addition to exploring the difference between two kinds of genes, two classifier models are developed to further access the predictive power of individual fractal feature. Figure
 | Fig. 2. Average AUC scores of essentiality prediction in 27 bacteria using Naïve Bayes (left) and Random Forest (right) classifier respectively. The exact values of this figure are provided in Supplement 1. |
On the other hand, the trend exists among all fractal features that the average classification accuracies using 100 balanced dataset from Mycobacterium tuberculosis H37Rv, Vibrio cholera N16961, and Salmonella enterica serovar Typhimurium 14028S are generally higher than those of others, improving 20%. Consequently, we propose that these fractal features are highly powerful annotation to make essentiality prediction and a better predictive performance is obtained by information dimension.
Since these fractal features are confirmed to be predictive to essentiality, we are interested in how many fractal features are independent among these fractal features. The Spearman correlation coefficients between pairs of those fractal features of all 27 bacteria are calculated and shown in Fig.
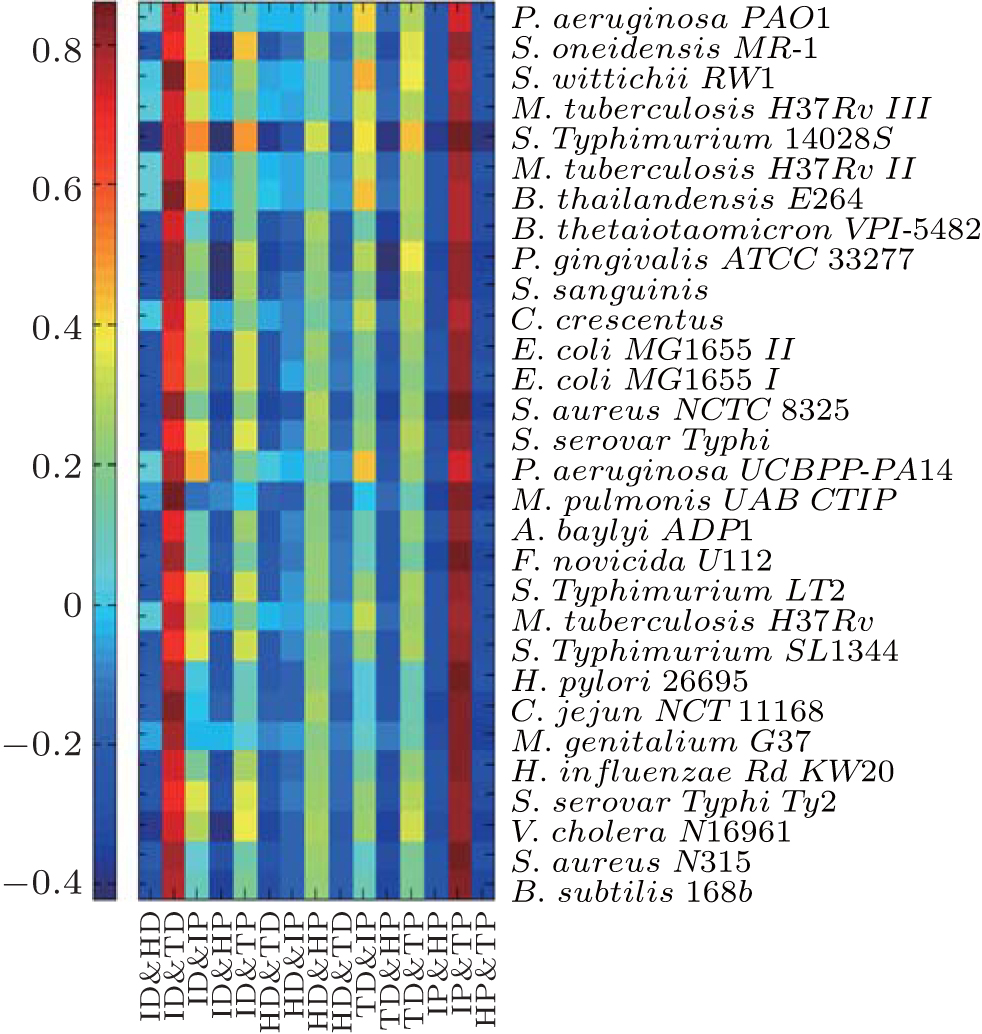 | Fig. 3. Spearman correlation coefficients between pairs of fractal features of all 27 bacteria. Significant correlations generally exist among these fractals at 5% level. The exact values of this figure are provided in Supplement 2. |
For 27 bacteria, Naïve Bayes and Random Forest classifiers are employed to make prediction of essentiality by integrating fractal features in three strategies: fractal features of gene sequences, fractal features of protein sequences, and all fractal features. The average AUC scores of using Naïve Bayes classifier are shown in Fig.
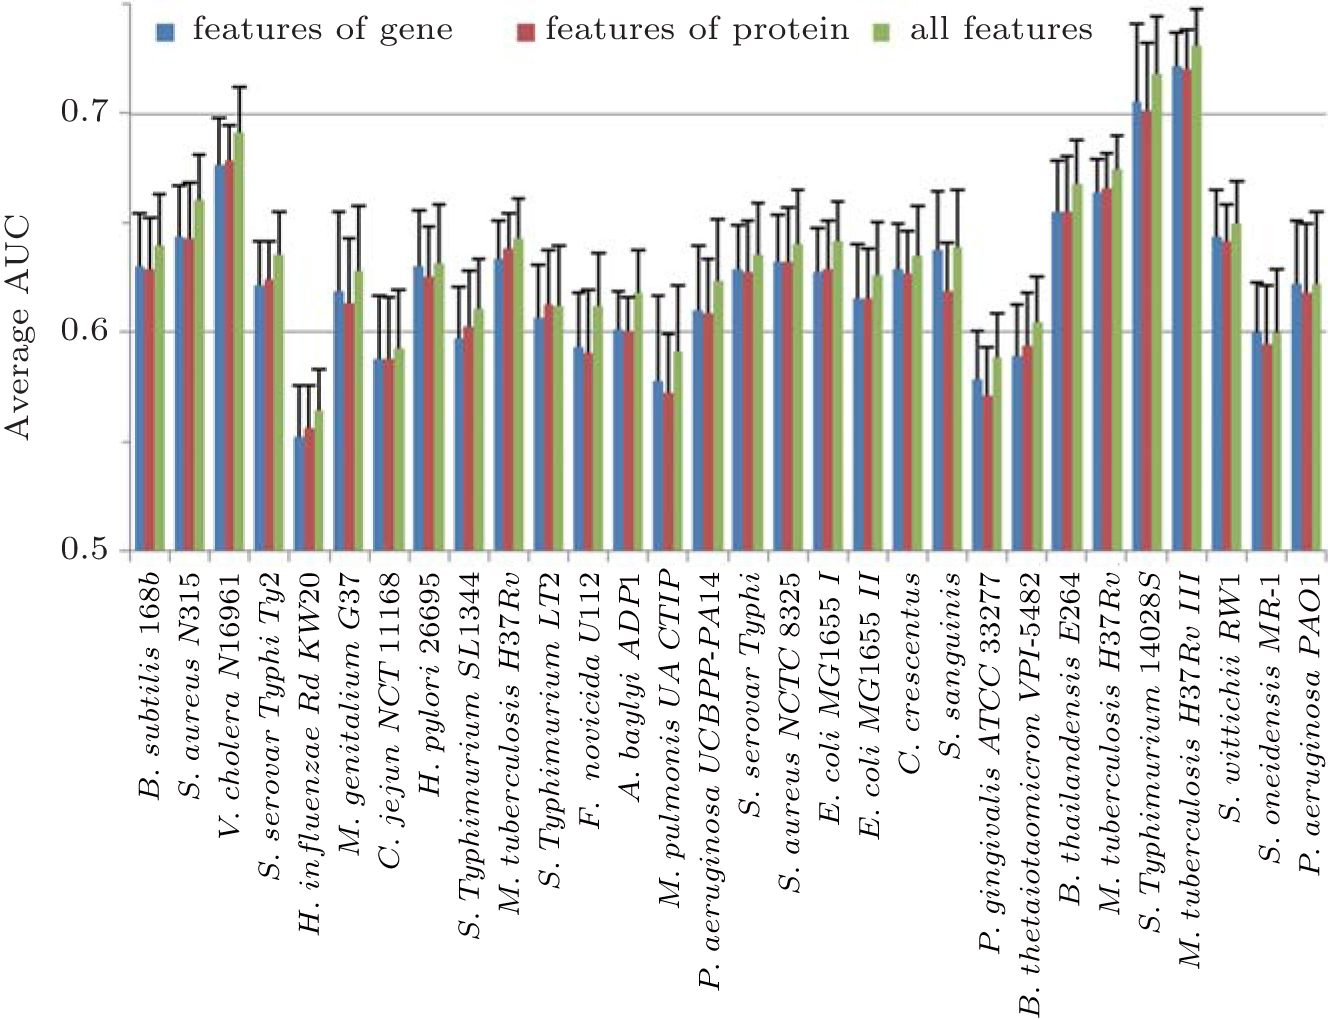 | Fig. 4. Mean values and SDs of AUC scores of genes essentiality prediction in 27 bacteria based on Naïve Bayes classifier trained by different integrations of fractal features. The average AUC scores of 27 bacteria are above 0.62. There are 15 (55.56%) bacteria obtaining better predictive performance with fractal features of gene sequences than that of protein sequences and 26 (96.26%) bacteria having better predictive performance by using all fractal features. |
 | Fig. 5. Mean values and SDs of AUC scores of genes essentiality prediction in 27 bacteria based on Random Forest classifier trained by different integrations of fractal features. The average AUC scores of 27 bacteria are above 0.64. There are 20 (75.07%) bacteria obtaining better predictive performance with fractal features of gene sequences than that of protein sequences and the better predictive performance is obtained by using all fractal features. |
On the other hand, there are 15 (55.56%) and 20 (75.07%) bacteria obtaining better predictive performance with fractal features of gene sequences than that of protein sequences, based on Naïve Bayes and Random Forest classifiers respectively. So, we deduce that gene fractal features maybe generally outperform protein sequences for gene essential prediction.
Additionally, for Naïve Bayes classifier, there are 26 (96.26%) bacteria having better predictive performance of all fractal features than those of two other integrating strategies, where the improvement of average AUC score of those bacteria is 0.034 (5.26%). For Random Forest, there are 27 (100%) bacteria of such a kind, and the average improvement of AUC score is 0.021 (3.87%). It suggests that we can construct a classifier with better predictive performance by integrating features of gene and protein sequence.
In recent years, several computational methods have been proposed to predict essential genes. In 2009, Acencio and Lemke constructed a decision tree-based meta-classifier based on network topological features, cellular compartments and biological processes to generate various predictors of essential genes.[24] Similarly, Palaniappan and Mukherjee used 52 input genomics, i.e., gene paralogs, sub-cellular location, Codon W features, etc., to learn the parameters of SVM classifier to predict essential genes.[36] In 2014 Ning et al. built an SVM classifier of gene essentiality by using all 158 features including Codon usage, amino acid usage, Codon W features, etc.[37] Tang et al. sought to measure essentiality by using PPI and gene expression data.[38] Here, we use those methods to make essentiality prediction in E. coli and then compare them with our classifier model through AUC score. The comparative result is shown in Fig.
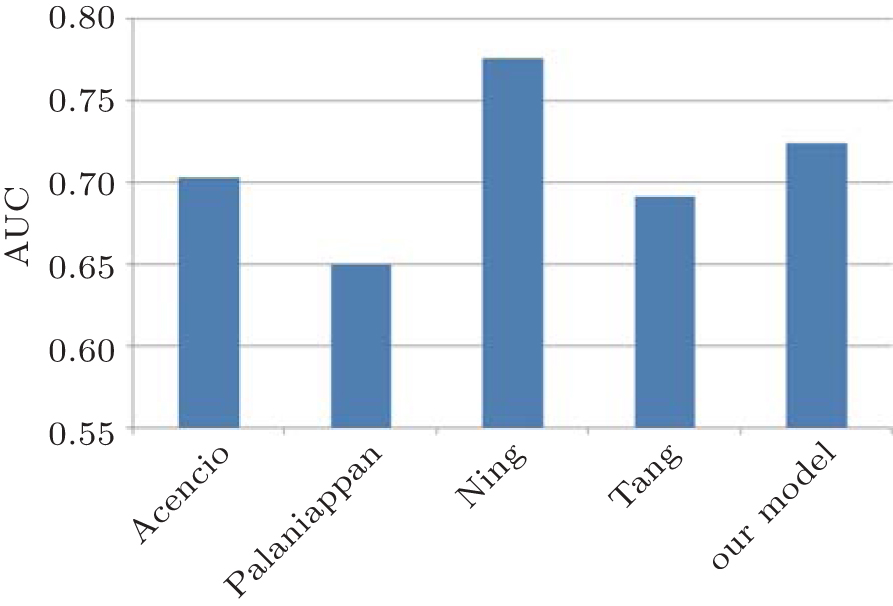 | Fig. 6. Comparative results between our classifier model and other four methods on predicting essential genes in E. coli by AUC score. |
The ability to consistently identify gene essentiality is of great significance to biological knowledge discovery and drug discovery operation, since it is basic requirement for sustaining organism alive. In this study, we assess the relationship between fractal features and essential genes by statistical analysis and machine learning-based methods, in hope of exploring the actual relationship between essentiality and these features, thus helping design computational tools to predict and screen essential genes from the bacterial genome. All currently available identified essential and non-essential genes and proteins in 27 bacteria from DEG database are studied in this paper. We find that essential genes significantly differ from non-essential genes in their fractal features in most bacteria. Because of the class imbalanced problem, we also design balanced training datasets to train Naïve Bayes and Random Forest classifiers with the aim of obtaining reliable results. The good performances of two classifiers imply that these fractal features are of powerful predictions of genes essentiality, either in integrative context or individually, although there are weak positive correlations among some of them.
Some studies have observed that genes essentiality powerfully relate to regulation complexity where the more targets a regulator has, the more important it is.[39] Our study provides facilitated access to quantitatively assess the regulation complexity of gene and protein sequences by fractal features. It is found that essential genes and proteins show higher regulatory complexity and less edited than nonessential genes and proteins. Essential genes are more evolutionarily conserved than non-essential gens and compared with non-essential proteins, essential proteins tend to enrich some function categories, such as transcription, translation and replication. However, they all have complex structures between deterministic and random, like chaotic attractors.
On the other hand, rapid and accurate identification of new essential gens requires learning classifier systems to integrate a subset of gene features and the work of Deng et al.[40] have shown integrations of both intrinsic and context-dependent features of genomic sequences help significantly improve the robustness and accuracy of prediction system. These fractal features in this study are intrinsic features which do not depend on external conditions. More importantly, they can be easily derived from primary genomic sequences, not relying on experimental environment. An additional advantage of our features over other attributes which only make sense to few specific model organisms is that their predictive utility keep reliable for 27 bacteria, which provides significant assist in the gene essentiality prediction in under-studied organisms.
In summary, through exploring the relationship between fractal feature and genes essentiality in different strategies, we come to the conclusion that these fractal features are effective and predictive quantitative indicators for checking bacterial essential genes by themselves and they are also promising contributors for designing computational tools identifying essential genes, either in combination strategy or individually. More broadly, the result obtained from our study will provide valuable information about synthetic biology and facilitate the annotations of microbial genomes and detection of potential drug target.
| 1 | |
| 2 | |
| 3 | |
| 4 | |
| 5 | |
| 6 | |
| 7 | |
| 8 | |
| 9 | |
| 10 | |
| 11 | |
| 12 | |
| 13 | |
| 14 | |
| 15 | |
| 16 | |
| 17 | |
| 18 | |
| 19 | |
| 20 | |
| 21 | |
| 22 | |
| 23 | |
| 24 | |
| 25 | |
| 26 | |
| 27 | |
| 28 | |
| 29 | |
| 30 | |
| 31 | |
| 32 | |
| 33 | |
| 34 | |
| 35 | |
| 36 | |
| 37 | |
| 38 | |
| 39 | |
| 40 |