Zhang Hong, Wen Shu-Long, Pan Min, Huang Zheng, Zhao Yong, Liu Xiang, Chen Ji-Ming. Stability of concentration-related self-interstitial atoms in fusion material tungsten. Chinese Physics B, 2016, 25(5): 056102
Permissions
Stability of concentration-related self-interstitial atoms in fusion material tungsten
Zhang Hong1, Wen Shu-Long1, Pan Min1, 3, †, , Huang Zheng1, ‡, , Zhao Yong1, Liu Xiang2, Chen Ji-Ming2
Key Laboratory of Advanced Technology of Materials, Superconductivity and New Energy R&D Center, Southwest JiaoTong University, Chengdu 610031, China
Fusion Science of Southwestern Institute of Physics, Chengdu 610041, China
Western Superconducting Technologies Company Limited, Xi’an 710018, China
Project supported by the Fundamental Research Funds for the Central Universities of Ministry of Education of China (Grant Nos. A0920502051411-5 and 2682014ZT30), the Program of International Science and Technology Cooperation, China (Grant No. 2013DFA51050), the National Magnetic Confinement Fusion Science Program, China (Grant Nos. 2011GB112001 and 2013GB110001), the National High Technology Research and Development Program of China (Grant No. 2014AA032701), the National Natural Science Foundation of China (Grant No. 11405138), the Southwestern Institute of Physics Funds, China, the Western Superconducting Technologies Company Limited, China, the Qingmiao Plan of Southwest Jiaotong University, China (Grant No. A0920502051517-6), and the China Postdoctoral Science Foundation (Grant No. 2014M560813).
Abstract
Abstract
Based on the density functional theory, we calculated the structures of the two main possible self-interstitial atoms (SIAs) as well as the migration energy of tungsten (W) atoms. It was found that the difference of the 〈110〉 and 〈111〉 formation energies is 0.05–0.3 eV. Further analysis indicated that the stability of SIAs is closely related to the concentration of the defect. When the concentration of the point defect is high, 〈110〉 SIAs are more likely to exist, 〈111〉 SIAs are the opposite. In addition, the vacancy migration probability and self-recovery zones for these SIAs were researched by making a detailed comparison. The calculation provided a new viewpoint about the stability of point defects for self-interstitial configurations and would benefit the understanding of the control mechanism of defect behavior for this novel fusion material.
Tungsten (W) has many attractive engineering properties, including high temperature strengths, good thermal conductivity, and low sputter rates. Therefore, tungsten and its alloys are promising candidates for plasma-facing components, such as the plate of the divertor in the international thermonuclear experimental reactor (ITER), which would be exposed to high-energy, high-flux neutrons.[1–4] The high-energy neutron irradiation gives rise to a large number of point defects, such as vacancies and self-interstitial atoms in the lattice. The long time evolution of point defects such as vacancies and SIAs into voids and clusters can break the structure of materials so as to degrade their lifetime. On the other hand, SIAs are easily produced as the same order of magnitude with vacancies under high-energy ion irradiation, especially under 14 MeV high-energy neutron irradiation in a fusion reactor.[5,6] As mentioned above, the energetic and kinetic properties of self-interstitial atoms (SIAs) play an important role in defect population evolution.[7,8] Studying structures and dynamics of SIAs is necessary to investigate the microstructure change with temperature in materials under irradiation.
Different configurations of SIAs would be generated since tungsten is irradiated by thermal neutrons, hydrogen and helium ions. Many recent researchers have been devoted to understanding the SIA configurations and migrations. The theory calculation based on the empirical potential was used to investigate the stable configuration, migration path of SIA and vacancies.[9–11] Previous studies and our calculations suggested that 〈111〉-type SIA configurations have the lowest formation energy in all nonmagnetic bcc metals[12,13] and the energy difference with that of the 〈110〉 dumbbell is about 0.28 eV. However, the ferromagnetic bcc α-Fe is fundamentally different from other bcc metals.[12] About 0.668 eV of the rotation energy for the migration barrier was obtained along an order of 〈111〉, 〈110〉, 〈111〉 by the nudged elastic band (NEB) method. The 〈110〉 dumbbell was proved to be a second-order saddle point by imaginary frequencies.[5] The generation and recombination of a defect is the key problem in determination of service behavior in irradiated materials.[14] However, the recovery curves have been obtained and discussed by measuring the electrical resistivity change with temperature. The isochronal anneals suggested that principal recombination regions can be observed at about 0.15Tm, 0.22Tm, and 0.31Tm (Tm is tungsten melting temperature),[15–18] which showed a phased stage for the point defect recovery. The recovery of the Frenkel pair defects was found to be nearly complete at 44 K.[15] Electron-irradiated tungsten results on relaxation strength versus stress direction suggested that the interstitials are probably 〈110〉 split rather than 〈111〉.[19] Therefore, obtaining a better understanding of SIAs is a critical issue in the research and development of materials in the fusion reactor.
In this paper, we calculated the structures of two main possible SIAs as well as the migration energy ofWatoms. The calculation would provide a new viewpoint about the stability of self-interstitial configurations, and it would benefit the understanding of the control mechanism of defect behavior for this novel fusion material.
2. Computation methods
The Vienna ab-initio Simulation Package (VASP) code[20] was performed in all calculations. The generalized-gradient approximation (GGA) and the Perdew–Burke–Ernzerh (PBE) were used to describe the exchange–correlation interaction. The periodic boundary conditions were considered in the simulation. A 4×4×4 k-point mesh was sampled by the Monkhorst and Pack scheme in the Brillouin zone.[21] For better ensuring the convergence of geometrical structures and total energies, the energy cutoff for calculations was 280 eV. The energy relaxation iterates until the force of all the atoms was less than 10−4 eV/Å. By optimizing the structure of the unit cell, the lattice constant a = 3.16 Å. The 〈111〉, 〈110〉, and 〈100〉 dumbbells were studied as SIAs. The supercell structures of 1×1×1, 2×2×2, 3×3×3, and 4×4×4 were used to calculate the formation energy of SIAs, respectively. The relaxation of atomic position and optimization of the lattice of the supercell were performed.
In the VASP calculation, unit cell immobilization as well as unit cell full optimization were performed to calculate the formation energy of 〈111〉, 〈110〉, and 〈100〉 dumbbells. The formation energy of SIA was calculated from
where Ef is the formation energy of the self-interstitial atom, En is the energy of the perfect super-cell, En+1 is the energy of the unit cell, and n is the number of atoms in the unit cell, respectively. In addition, the atomic density in the super-cell was calculated along the directions of 〈111〉, 〈110〉, and 〈100〉, and the influence of the defect concentration on the formation energy of SIAs was investigated.
3. Results and discussion
3.1. Stability of the self-interstitial atom configurations
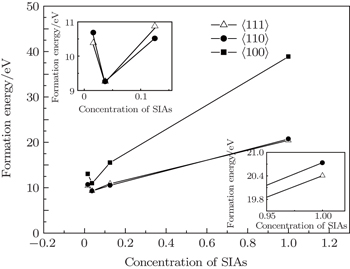
We examined the stabilities of SIAs including 〈001〉, 〈110〉, and 〈111〉 dumbbells in W. Figures 1 and 2 plot the formation energies of these defects. Unit cell immobilization and full optimization were performed to calculate the formation energy of these dumbbells. In order to investigate the influence of defect concentration on the stability of SIA configurations, the super-cell structures of 1×1×1, 2×2×2, 3×3×3, and 4×4×4 were used to calculate the formation energy of SIAs, respectively. The volumes (V) of the super-cells were calculated as 1, 8, 27, and 64, respectively. In this model, 1/V was used to represent the concentration of the SIAs.
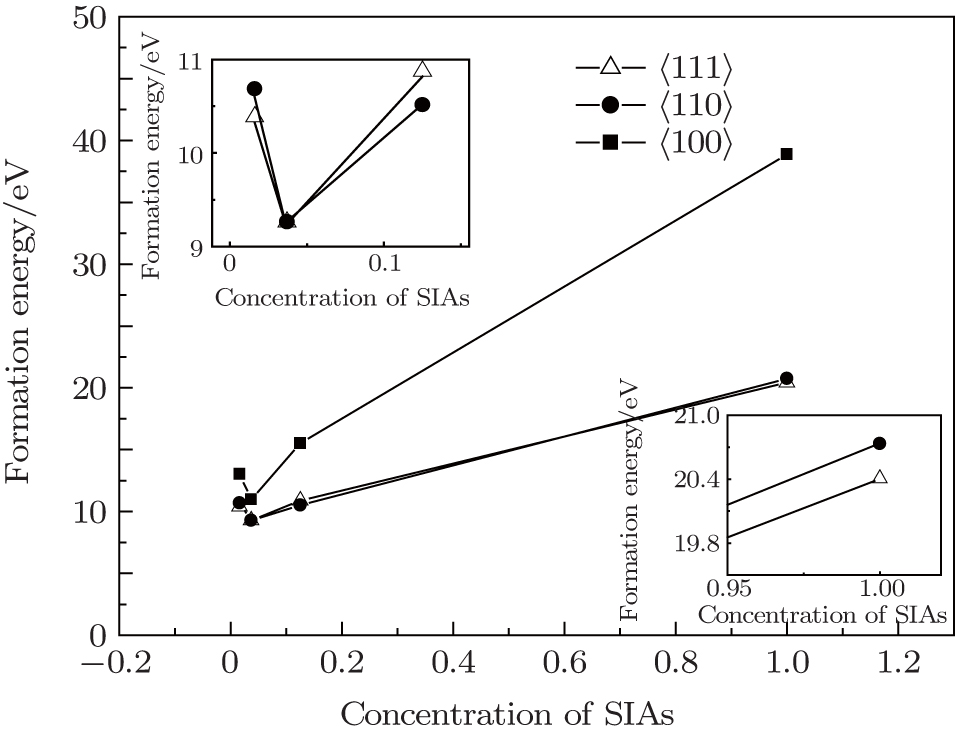
Fig. 1. The formation energy of a self-interstitial atom as a function of the SIA concentration (the formation energy calculated under unit cell immobilization); the inserts are the magnification figures of the SIA concentration less than 0.2 and more than 0.9, respectively.
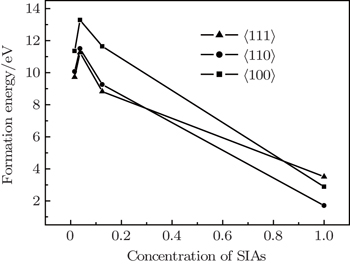
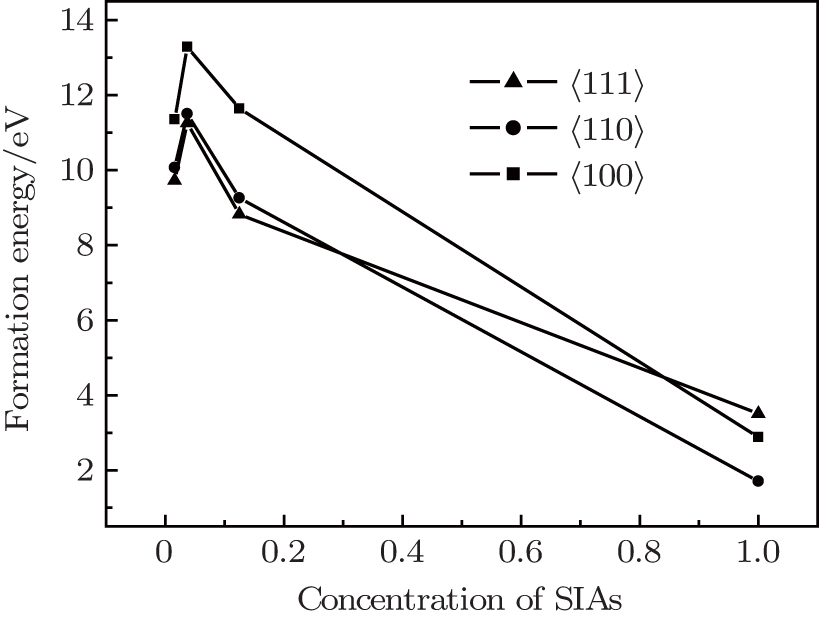
Fig. 2. The formation energy of a self-interstitial atom as a function of SIA concentration (the formation energy calculated under unit cell full optimization).
As shown in Fig. 1, at the same concentration of SIAs, the formation energy of a self-interstitial atom for 〈100〉 dumbbells is always the biggest, while the difference of the formation energy between with 〈111〉 and 〈110〉 dumbbells is very small, about 0.05 eV to 0.3 eV. It is likely to show that the 〈110〉 is a kind of metastable phase in SIAs of W lattice.
In order to approximate the experimental value, the crystal structure and the coordinate of the ions were relaxed, and the formation energy of the 〈100〉, 〈110〉, and 〈111〉 dumbbells SIAs was calculated. As shown in Fig. 2, when the concentration of SIAs is larger than 0.3, the formation energy of a self-interstitial atom for the 〈110〉 is the lowest in the three configurations. With the decrease of the concentration of SIAs, the formation energy of 〈111〉 dumbbells can be the lowest. It indicates that the stability of the SIAs has a close relationship with the defect concentrations in W lattice, 〈110〉 SIAs are more likely to exist in materials with higher concentration defects, while the 〈111〉 is stable in materials with low defect concentrations. In addition, it means that with the increase of the defect concentration, the configuration of the defect is converted from 〈111〉 to 〈110〉.
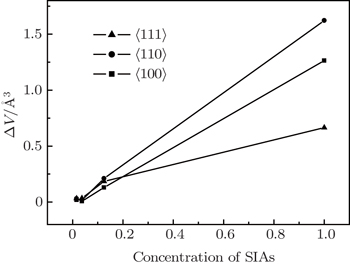
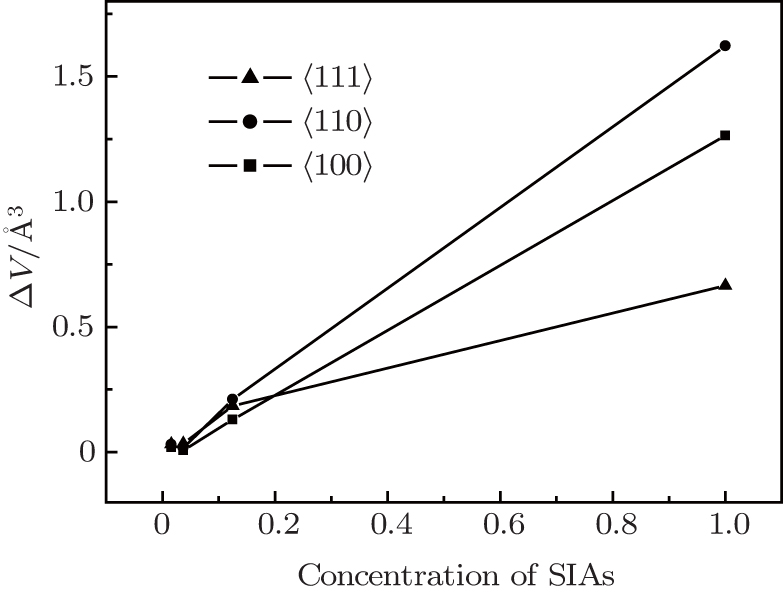
To a certain extent, the volume in the supercell reflects the stress among the atoms which directly restrict the formation of SIAs. The volume of atoms was calculated for different super-cells of 1×1×1, 2×2×2, 3×3×3, 4×4×4 and perfect lattices. The difference of the volumes between the defected supercell structure and perfect lattice structure indirectly reflects the stress between SIAs and other nearest atoms. In this paper, the volume difference ΔV as a function of the SIA concentration is shown in Fig. 3. It can be seen that when the concentration of SIAs is larger than about 0.2, ΔV of the 〈110〉 is the biggest in the three configurations. It means that the stress of SIAs for the 〈110〉 is the lowest in the three configurations when the concentration of SIAs is larger than 0.2 which is little smaller than the variation of SIA formation energy. However, this does not affect the consistence of the SIA stress and the variation of SIA formation energy. It means that the different concentrations of SIA defects affect the stress of SIAs, therefore, the formation energy of SIAs is affected.
Fig. 3. The volume difference of the supercell as a function of the SIA concentration.
3.2. Properties of the SIA self-recovery
To further understand the stability of the self-interstitial atom configurations, the characteristics of self-recovery of SIA defects were investigated. The super-cell structure of 4×4×4 was used to calculate the formation energy of the system in the process of the mono-vacancy migration. As discussed above, the formation energy of 〈100〉 dumbbells is far larger than those of 〈110〉 and 〈111〉 dumbbells. Therefore, point defects of the SIA configurations of 〈110〉 and 〈111〉 dumbbells were investigated and the energy of the self-recovery of SIAs and the single vacancy were calculated. The calculated results of 〈110〉 and 〈111〉 defect configurations were contrasted.
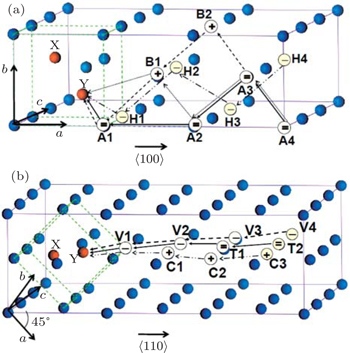
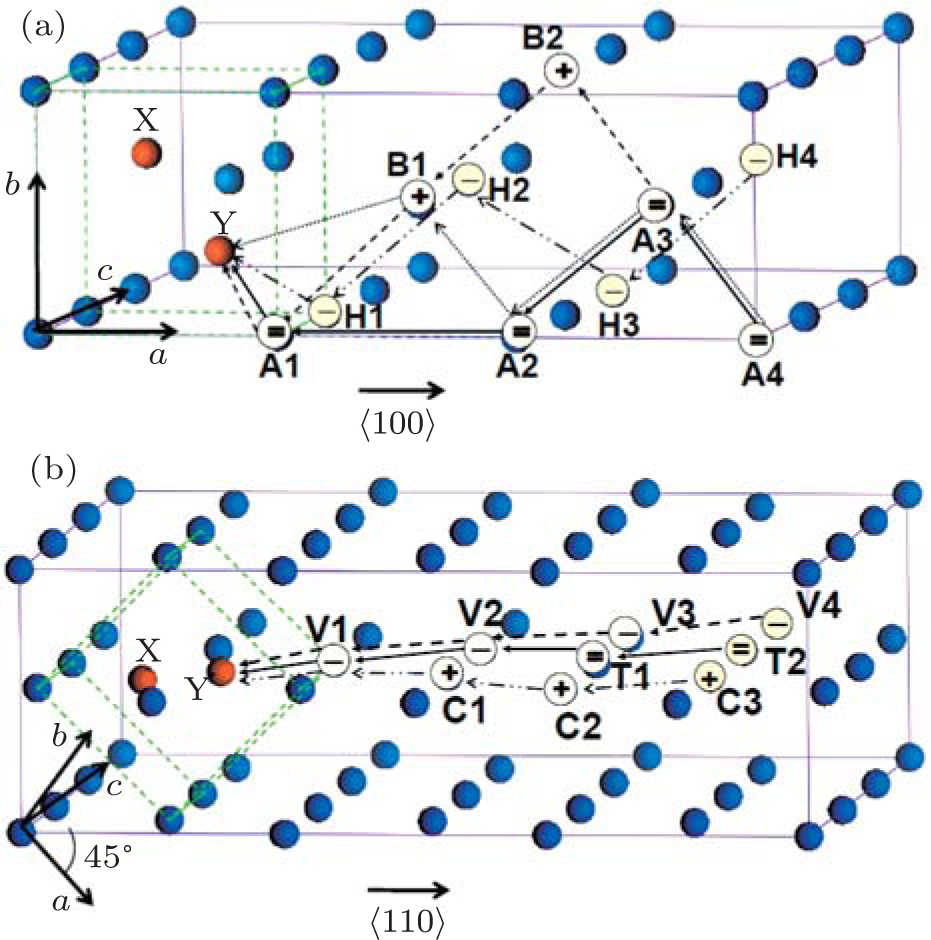
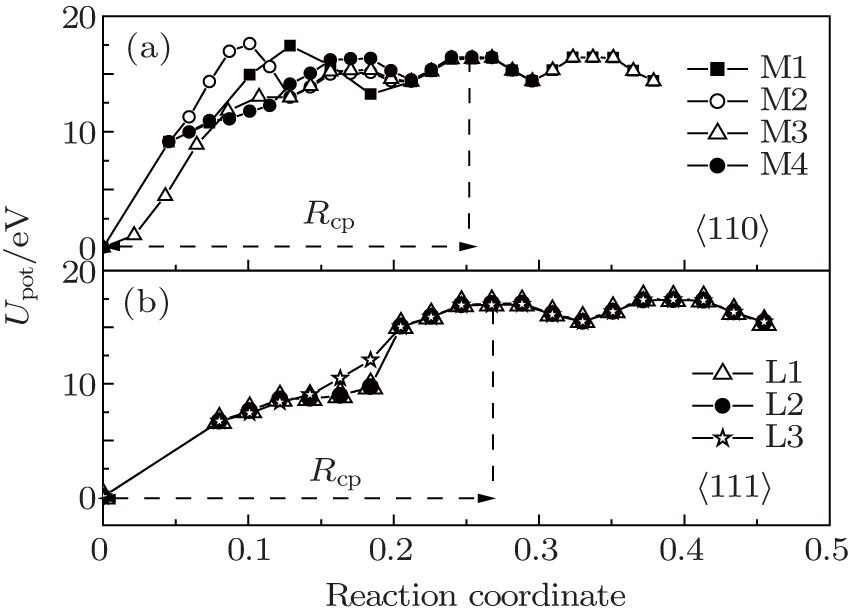
Figure 4 shows a recovery path model of Frenkel pairs of SIAs and single vacancies for 〈110〉 and 〈111〉 dumbbells. As shown in Fig. 4, the vacancy migration pathways in W lattice are enumerated. In the reaction zone, X and Y represent SIA pairs at the lattice body center, four pathways of 〈110〉 defect recovery and three pathways of 〈111〉 defect recovery are named M1, M2, M3, M4, and L1, L2, L3, respectively. In accordance with the model, the energy of the system in the process of the single vacancy from far to near SIA was calculated and the calculation results are shown in Fig. 5. As shown in Fig. 5, the progress for a vacancy would go throughout a kind of threshold energy curve and comes into the recombination region. From the energy of Frenkel pairs of the system, we can see that the recombination laws of the two type defects are similar. For the long distance, the migration process of the vacancy is not related to the kind of configuration of interstitial atoms, and the energy of the vacancy migration is about 2 eV. In the region of point defect recombination as well as the region of point defect-concentrated reaction, a kind of recombination energy and a spontaneous recombination region appear. Comparing Figs. 5(a) and 5(b), the reaction region of 〈111〉 configuration is greater than that of 〈110〉 configuration.
Fig. 4. The recovery model of Frenkel pairs for the interstitial atoms and single vacancies. The super-cell structures are 4×4×4. (a) The 〈110〉 Frenkel pair of the interstitial configuration. (b) The 〈111〉 Frenkel pair of the interstitial configuration, “X and Y” represent the SIAs. The vacancy migration pathways in W lattice are: M1: atom A4→A3→A2→A1→Y; M2: atom A3→B2→B1→A1→Y; M3: atom A4→A3→A2→B1→Y; M4: atom H4→H3→H2→H1→Y; L1: atom V4→V3→V2→V1→Y; L2: atom T2→T1→V2→V1→Y; L3: atom C3→C2→C1→V1→Y.
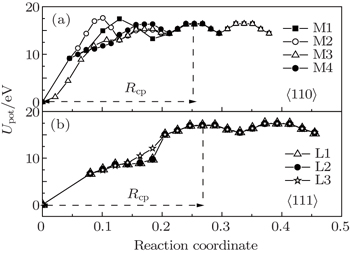
Fig. 5. The potential energy Upot as a function of the distance of SIAs and mono-vacancy (direction coordinate) in different migrating pathways; the mono-vacancy is assumed to go towards SIAs along these pathways. (a) M1, M2, M3, M4 and (b) L1, L2, L3.
For a more detailed investigation of the two defect structures, the corresponding recombination parameters related to the Frenkel pair recombination process were calculated from the SIA recombination curve and the values are listed in Table 1. The migration barrier energy Em was calculated by the difference between the energy at the saddle point and the valley point, Rsr is the spontaneous recombination radius of the vacancy and the SIA and has long-axis and short-axis values, Rcp is the maximum I–V distance of the Frenkel pair recombination process and has long-axis and short-axis values, Er is the energy required to be recombination of the Frenkel in the range of Rcp and can be calculated by the difference between the energy at the saddle point and the valley point of the energy curve in the range of Rcp shown in Fig. 5. In our calculations, it represents the probability of an interstitial atom’s recombination with different configurations.
Table 1.
Table 1.
Table 1.
The recombination parameters according to the Frenkel pair recombination process of SIAs.
.
〈110〉
〈111〉
Em
1.9–2.14 eV
1.86–2.08 eV
Er
1.6 eV
1.58 eV
Rsr
4.48 Å; 2.74 Å
5.5 Å; 2.7 Å
Rcp
6.90 Å; 3.17 Å
8.2 Å; 4.5 Å
Zcp
66
72
Table 1.
The recombination parameters according to the Frenkel pair recombination process of SIAs.
.
As shown in Table 1, the migration energy Em of the vacancy in the recombination process of the 〈111〉 configuration is smaller than that of the 〈110〉 configuration. The recombination energy Er is the same as the migration energy Em. The Rsr and Rcp of the 〈111〉 configuration are larger than those of the 〈110〉 configuration. The number of the defect recombination Zcp of the 〈111〉 configuration is also larger than that of the 〈110〉 configuration. These results show that the SIA defects of 〈111〉 configuration are easier to recover than those of 〈110〉 configuration.
When W material is under irradiation damage, the concentration of point defects near the surface of the material is relatively large. The calculation of the recombination process shows that the recovery probability of these high concentration regions is smaller than that in the low concentration region of the material. In the interior of the material, at low concentration of these defects, the recovery probability of point defects is high in the migration and recombination process. Our calculations also provide a theoretical reference for the study of W in the recovery theory of point defects at high temperature under the irradiation environment.
4. Conclusion
The stability of SIAs has a close relation with the defect concentration in W lattice, 〈110〉 SIAs are more likely to exist when facing a higher concentration of point SIA defects, while the 〈111〉 SIAs are stable in materials with low defect concentrations. The results of the Frenkel pair recombination processes give a reference for the recovery probability of point defects for high concentration region that was smaller than that for the low concentration region in the W material. This is conducive to the understanding of the control mechanism of defect behavior for this novel fusion material.


 , Huang Zheng1, ‡,