Comparison of blue–green response between transmission-mode GaAsP- and GaAs-based photocathodes grown by molecular beam epitaxy
Jiao Gang-Cheng1, 2, †,  , Liu Zheng-Tang1, Guo Hui2, Zhang Yi-Jun3
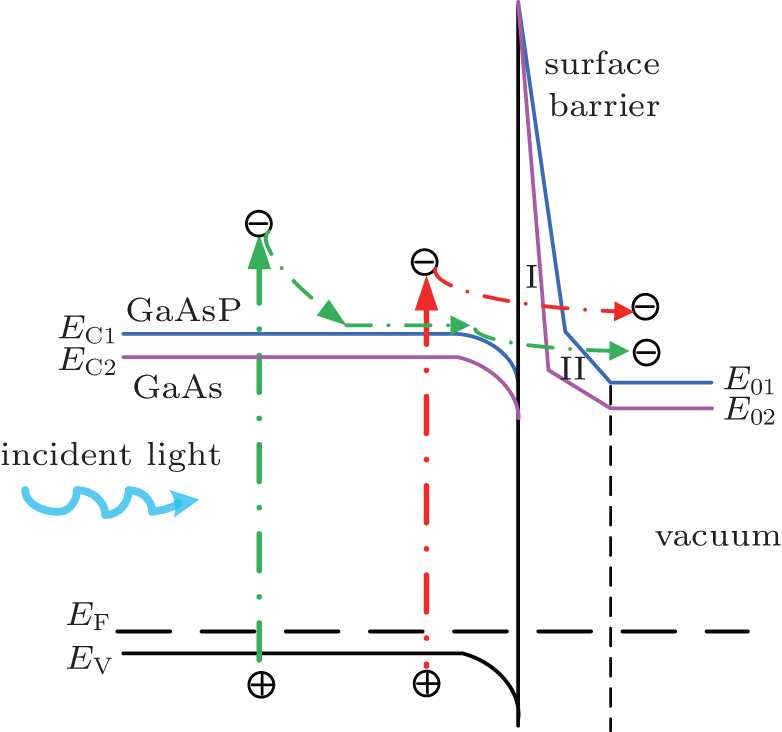
, Liu Zheng-Tang1, Guo Hui2, Zhang Yi-Jun3 Schematic band structures and surface barriers of the GaAsP and GaAs photocathode.