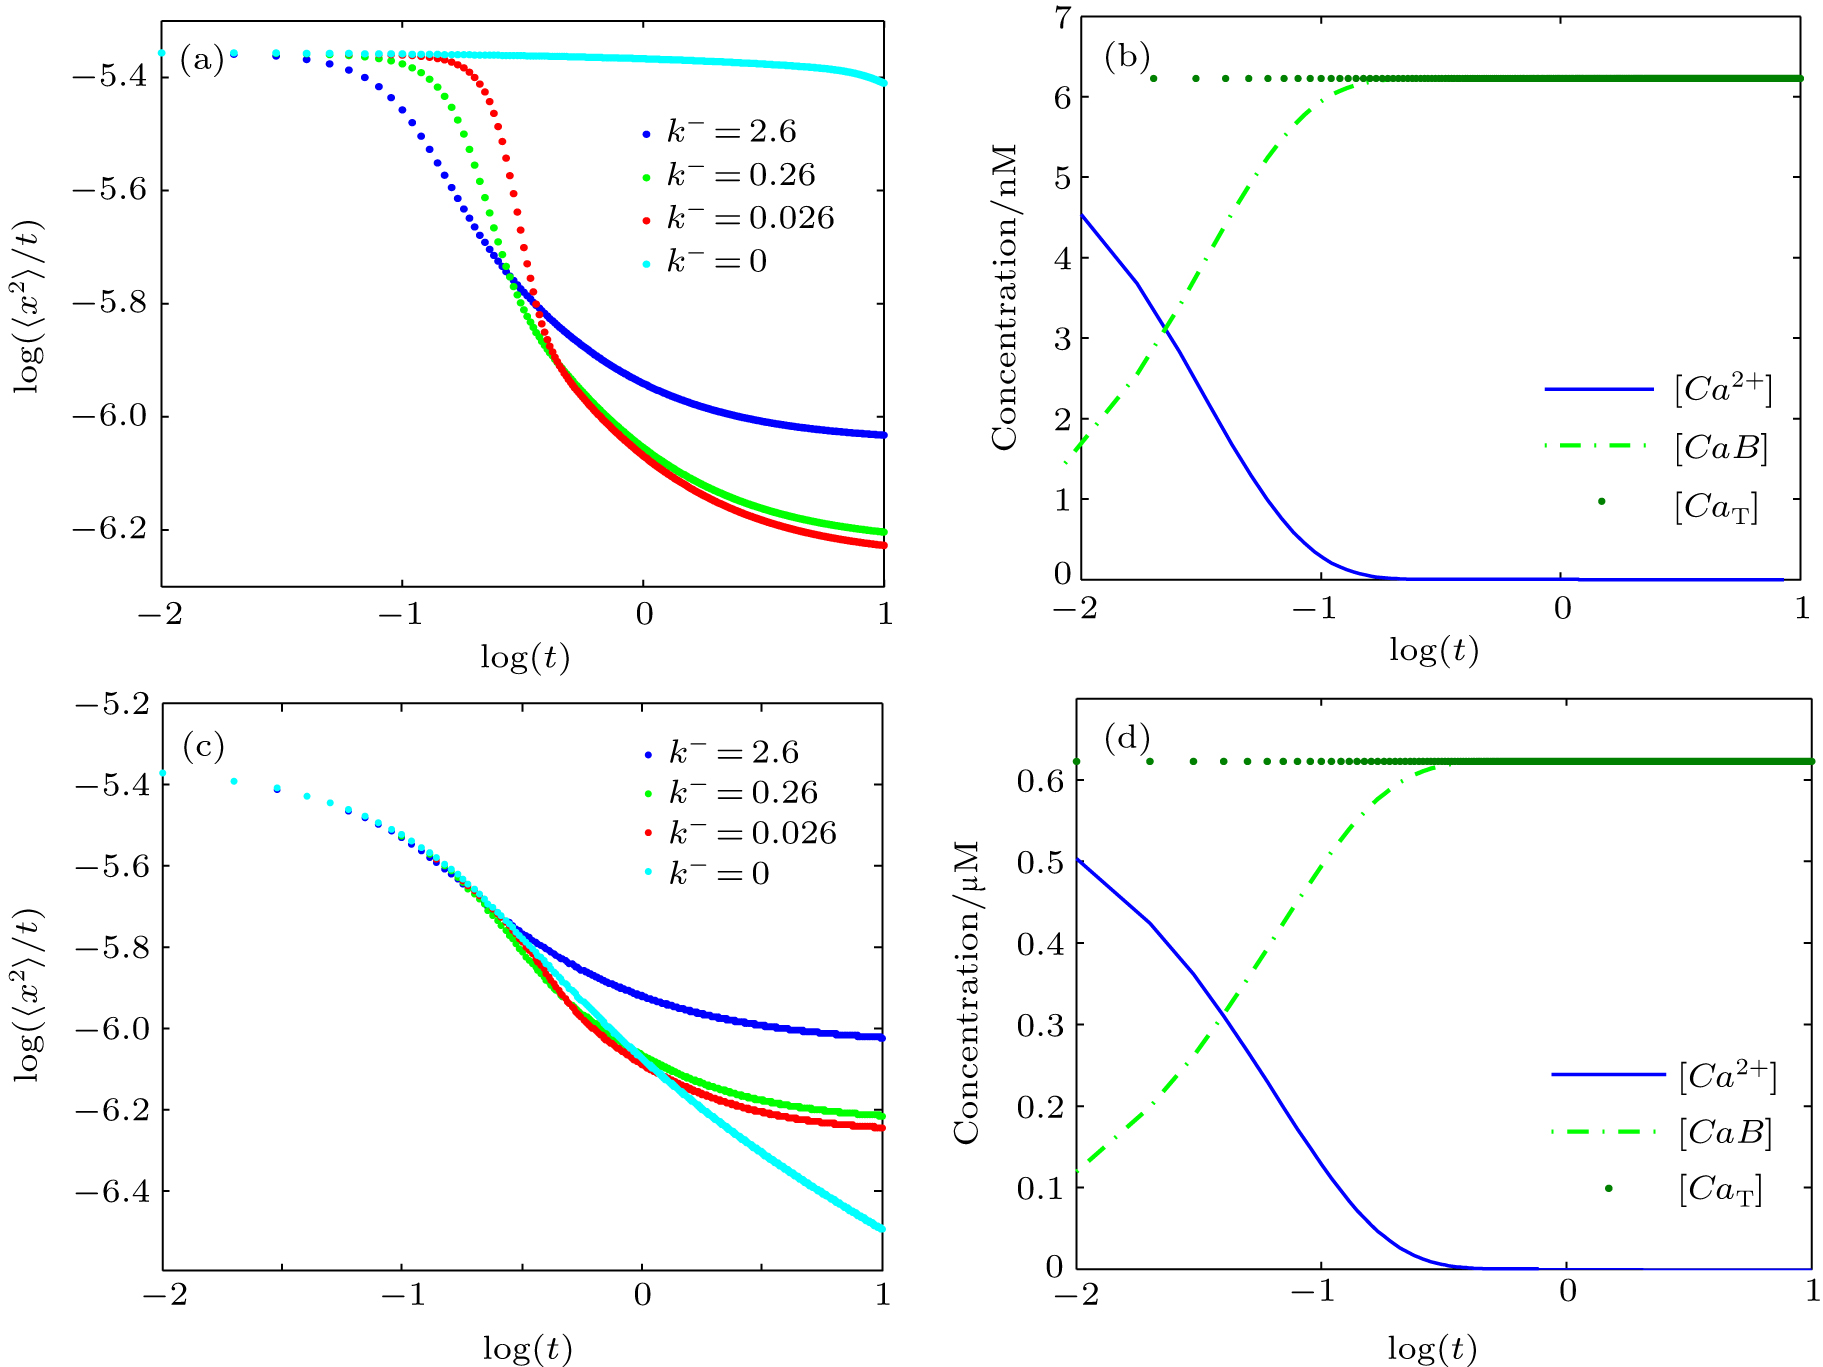
(a) Plots of log (〈x2〉/t) versus logt for various values of dissociation rate (k−) in the case of calcium diffusion in mobile buffers at [Bm]0 = 26.4 μM and [Ca2+]0 = 6.23 nM; (b) concentration changes of Ca2+, CaBm, and CaT for k− = 0; (c) plots of log(〈x2〉/t) versus logt for various values of dissociation rates (k−) in the case of calcium diffusion in mobile buffers at [Bm]0 = 26.4 μM and [Ca2+]0 = 0.623 μM; (d) time-dependent concentration variations of Ca2+,CaBm, and CaT for k− = 0. |

