Computational analysis of the roles of biochemical reactions in anomalous diffusion dynamics
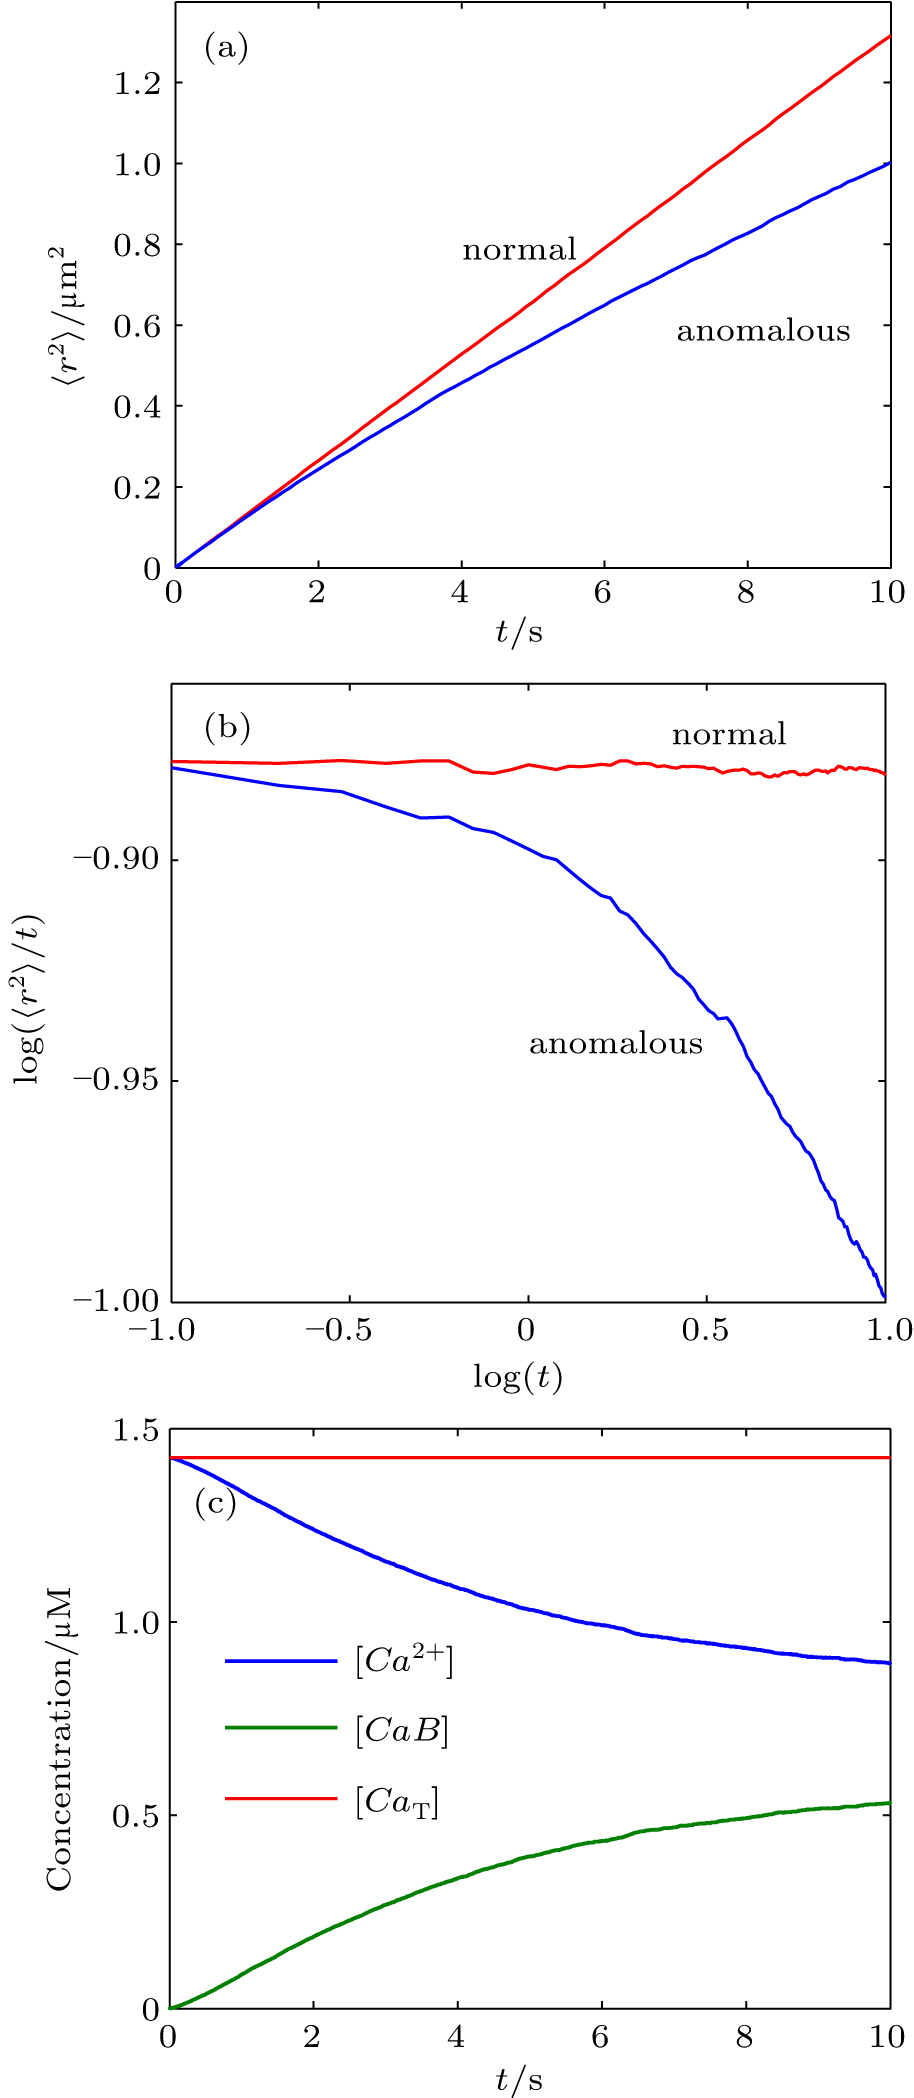
(a) Monte Carlo results for the mean-square displacement, 〈

Computational analysis of the roles of biochemical reactions in anomalous diffusion dynamics |
(a) Monte Carlo results for the mean-square displacement, 〈 |
 |